Deep Learning
Image classification
Image classification is not an easy problem because of the variations in the location of the object, lighting, background, camera angle, camera focus etc.

Introduction to neural networks
- Neural networks can be viewed a generalization of linear models where we apply a series of transformations.
- Below we are adding one “layer” of transformations in between features and the target.
- We are repeating the the process of computing the weighted sum multiple times.
- The hidden units (e.g., h[1], h[2], …) represent the intermediate processing steps.

One more layer of transformations
- Now we are adding one more layer of transformations.

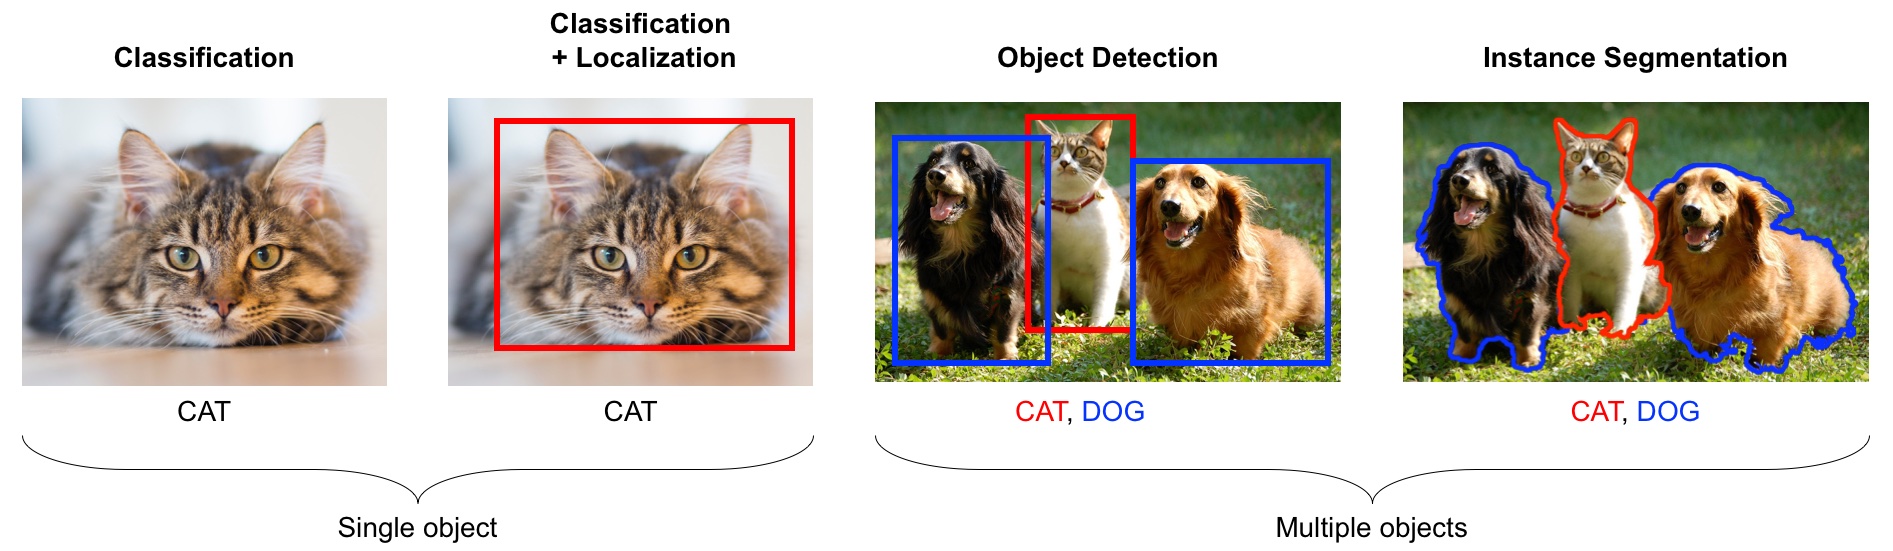
Introduction to computer vision
- image classification: is this a cat or a dog?
- object localization: where is the cat in this image?
- object detection: What are the various objects in the image?
- instance segmentation: What are the shapes of these various objects in the image?
- and much more…
Pre-trained models out-of-the-box

- Let’s first apply one of these pre-trained models to our own problem right out of the box.
Pre-trained models out-of-the-box
- Let’s predict labels with associated probabilities for unseen images
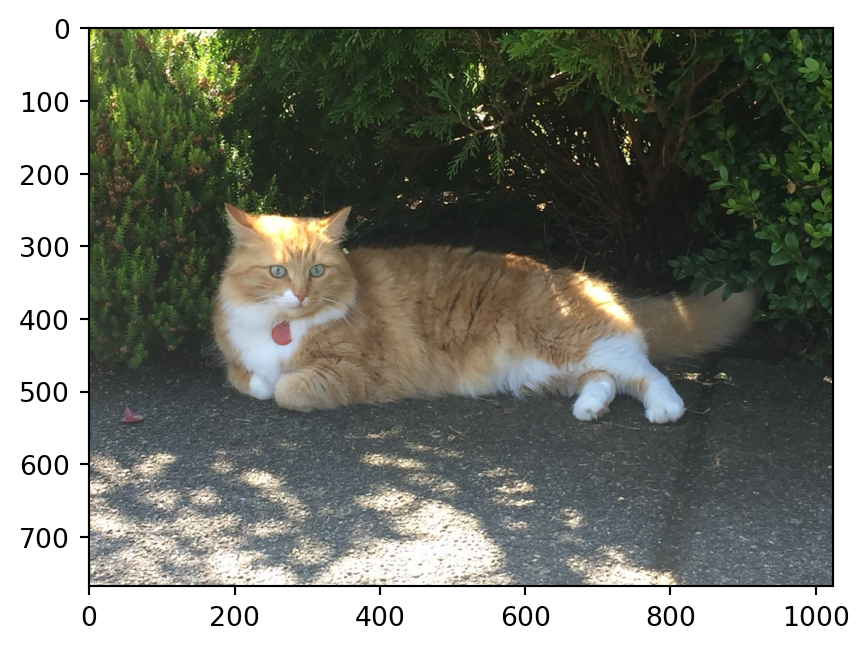
                         Class  Probability score
                     tiger cat              0.353
              tabby, tabby cat              0.207
               lynx, catamount              0.050
Pembroke, Pembroke Welsh corgi              0.046
--------------------------------------------------------------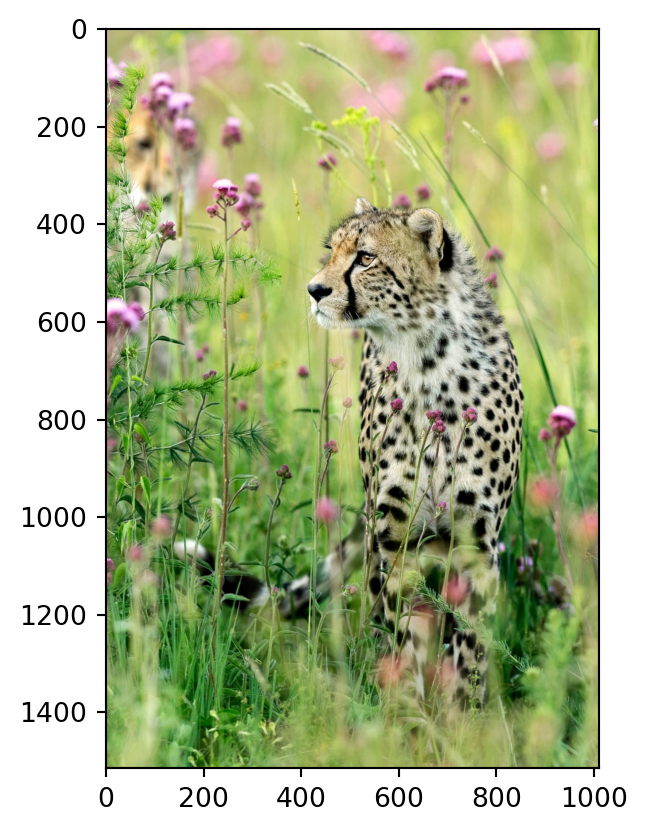
                                     Class  Probability score
         cheetah, chetah, Acinonyx jubatus              0.983
                  leopard, Panthera pardus              0.012
jaguar, panther, Panthera onca, Felis onca              0.004
       snow leopard, ounce, Panthera uncia              0.001
--------------------------------------------------------------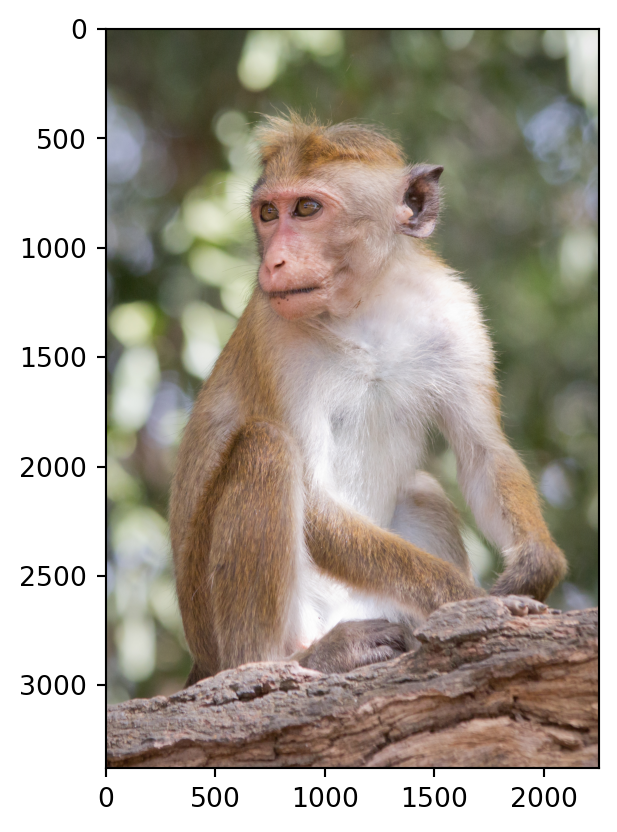
                                   Class  Probability score
                                 macaque              0.714
patas, hussar monkey, Erythrocebus patas              0.122
      proboscis monkey, Nasalis larvatus              0.098
                   guenon, guenon monkey              0.017
--------------------------------------------------------------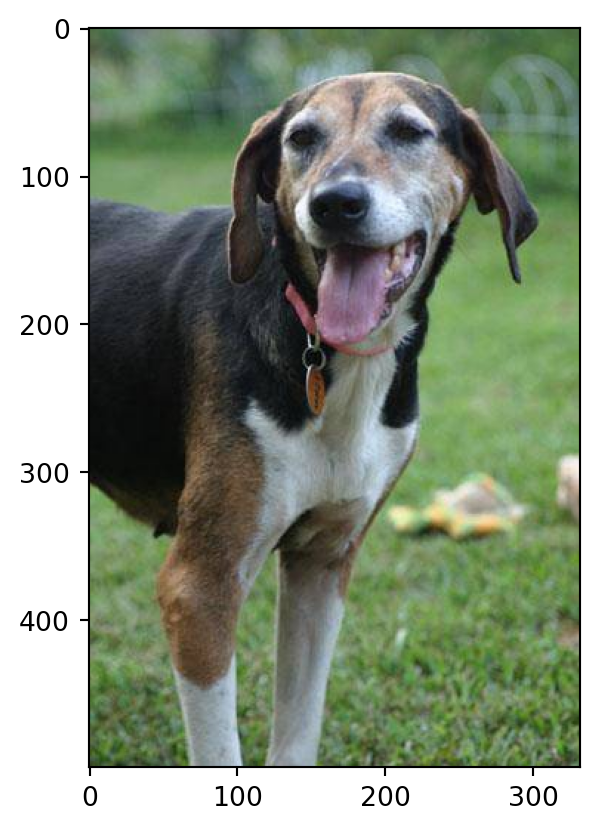
                        Class  Probability score
Walker hound, Walker foxhound              0.580
             English foxhound              0.091
                  EntleBucher              0.080
                       beagle              0.065
--------------------------------------------------------------
Pre-trained models out-of-the-box
- Let’s try some images which are unlikely to be there in ImageNet.
- It’s not doing very well here because ImageNet doesn’t have proper classes for these images.
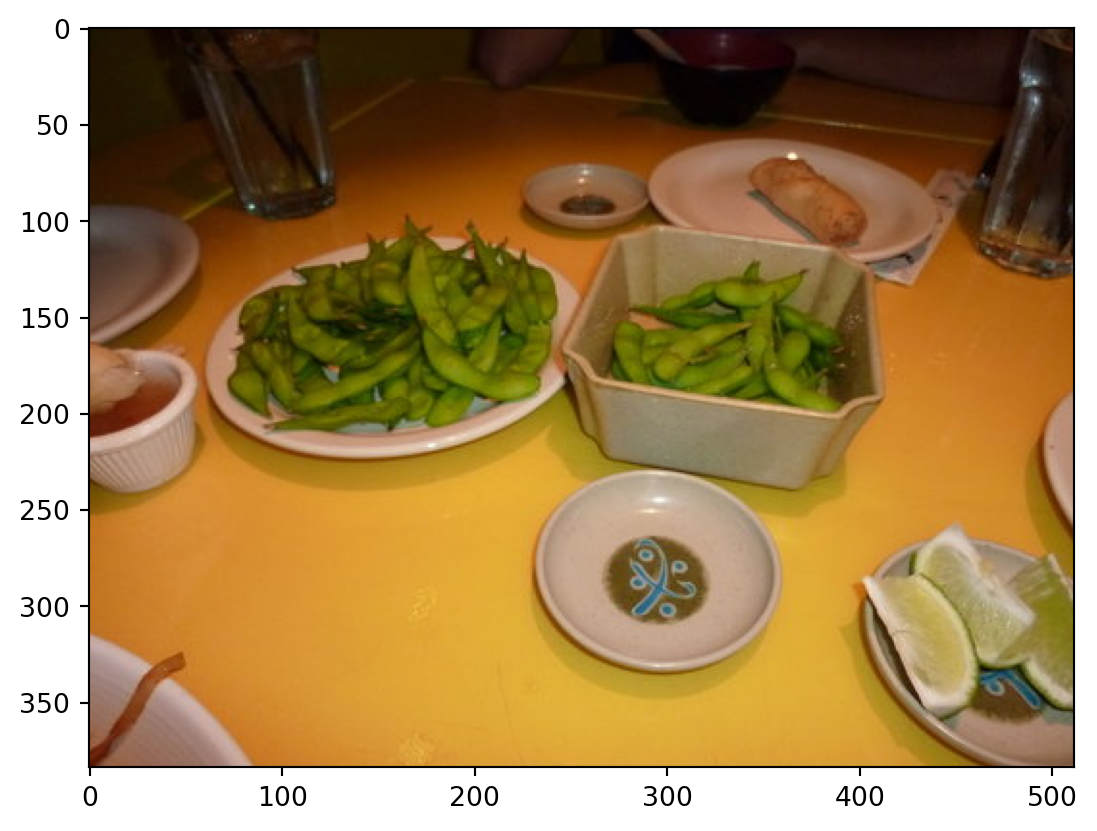
         Class  Probability score
cucumber, cuke              0.146
         plate              0.117
     guacamole              0.099
  Granny Smith              0.091
--------------------------------------------------------------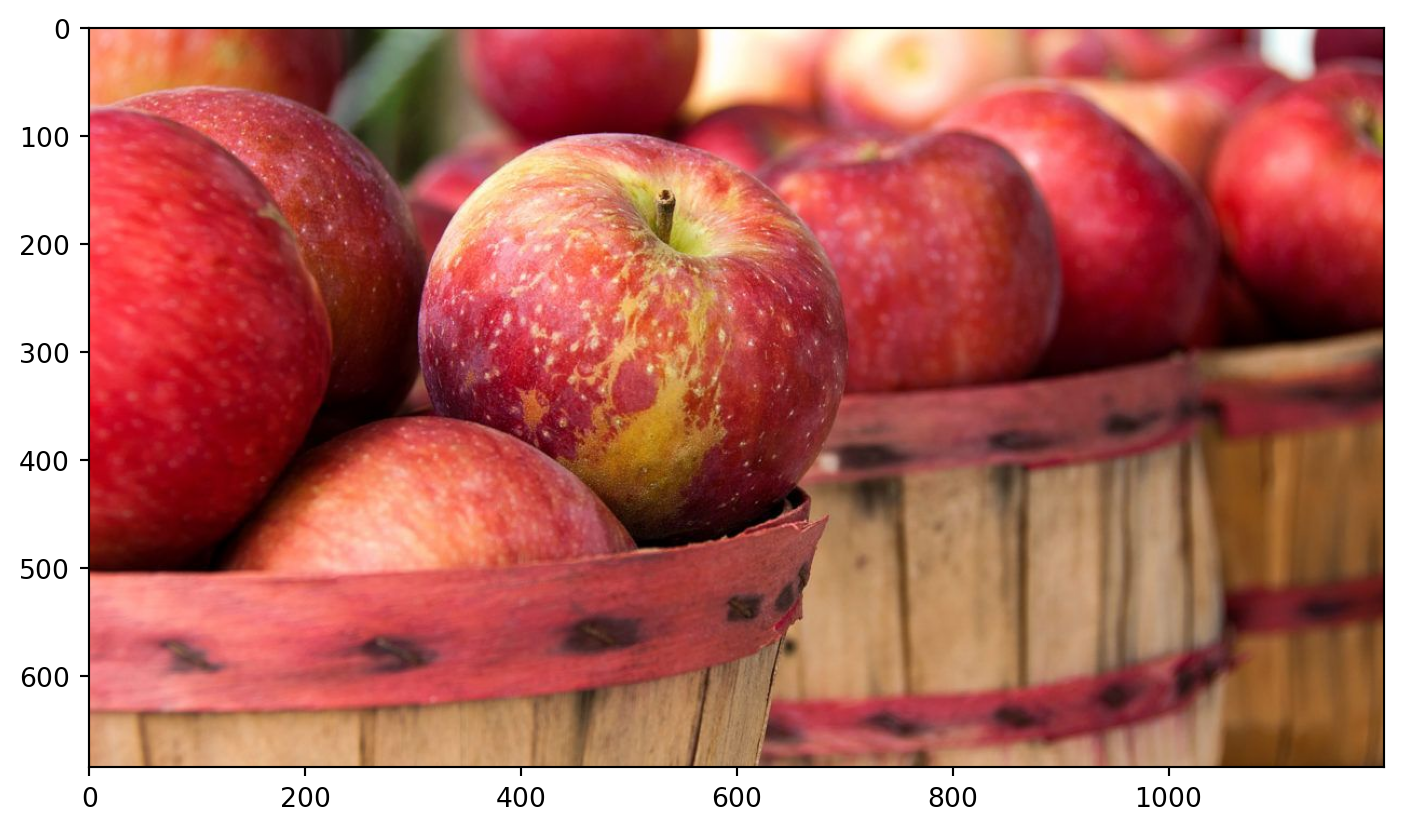
                                      Class  Probability score
                                        fig              0.637
                                pomegranate              0.193
grocery store, grocery, food market, market              0.041
                                      crate              0.023
--------------------------------------------------------------
                                               Class  Probability score
                                         toilet seat              0.171
                                          safety pin              0.060
bannister, banister, balustrade, balusters, handrail              0.039
                                              bubble              0.035
--------------------------------------------------------------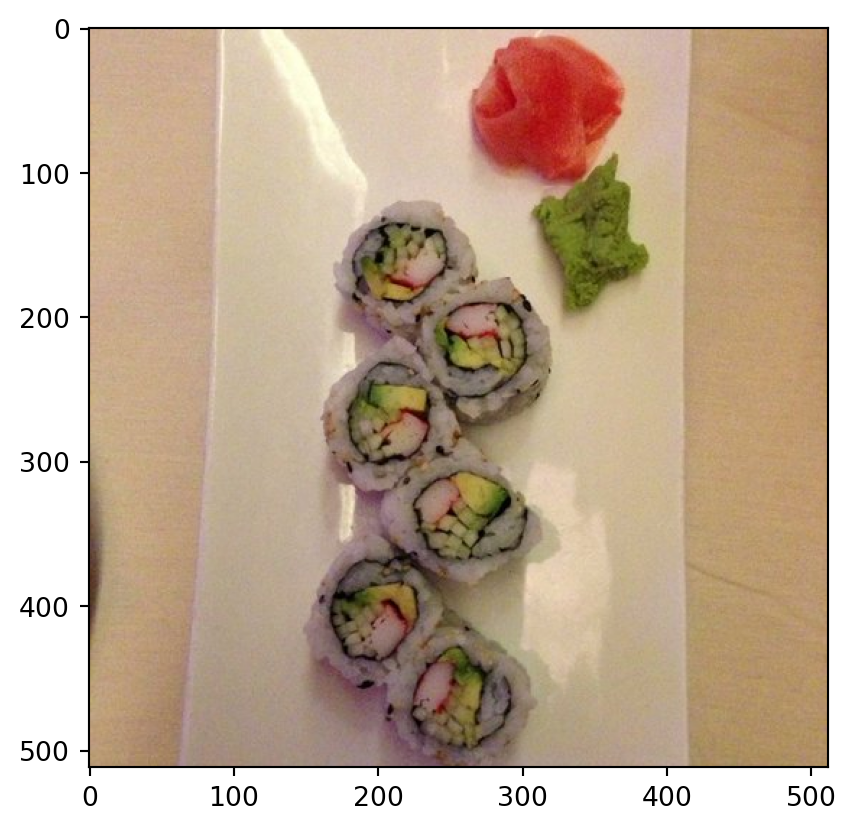
                  Class  Probability score
                   vase              0.078
                thimble              0.074
             plate rack              0.049
saltshaker, salt shaker              0.047
--------------------------------------------------------------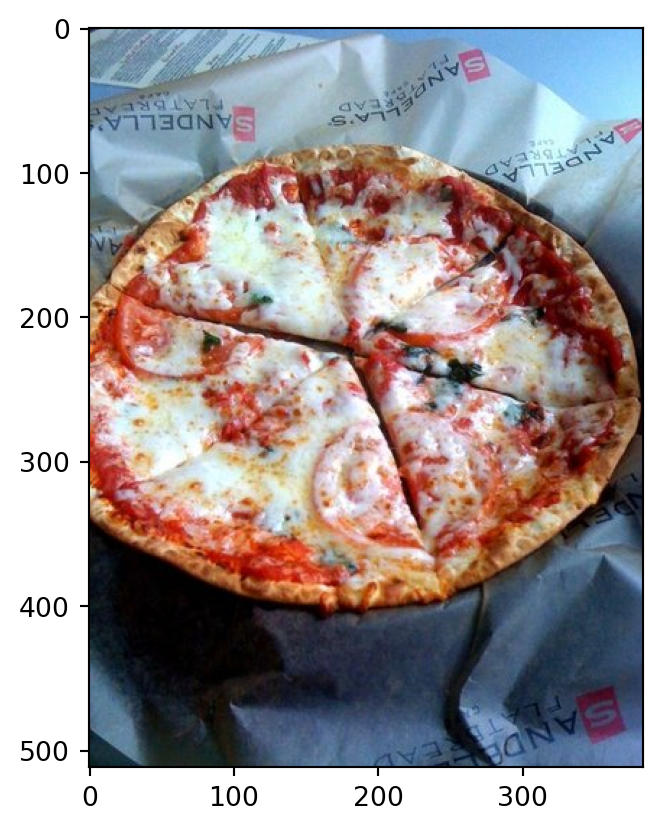
                      Class  Probability score
           pizza, pizza pie              0.998
frying pan, frypan, skillet              0.001
                     potpie              0.000
                French loaf              0.000
--------------------------------------------------------------
Class Probability score
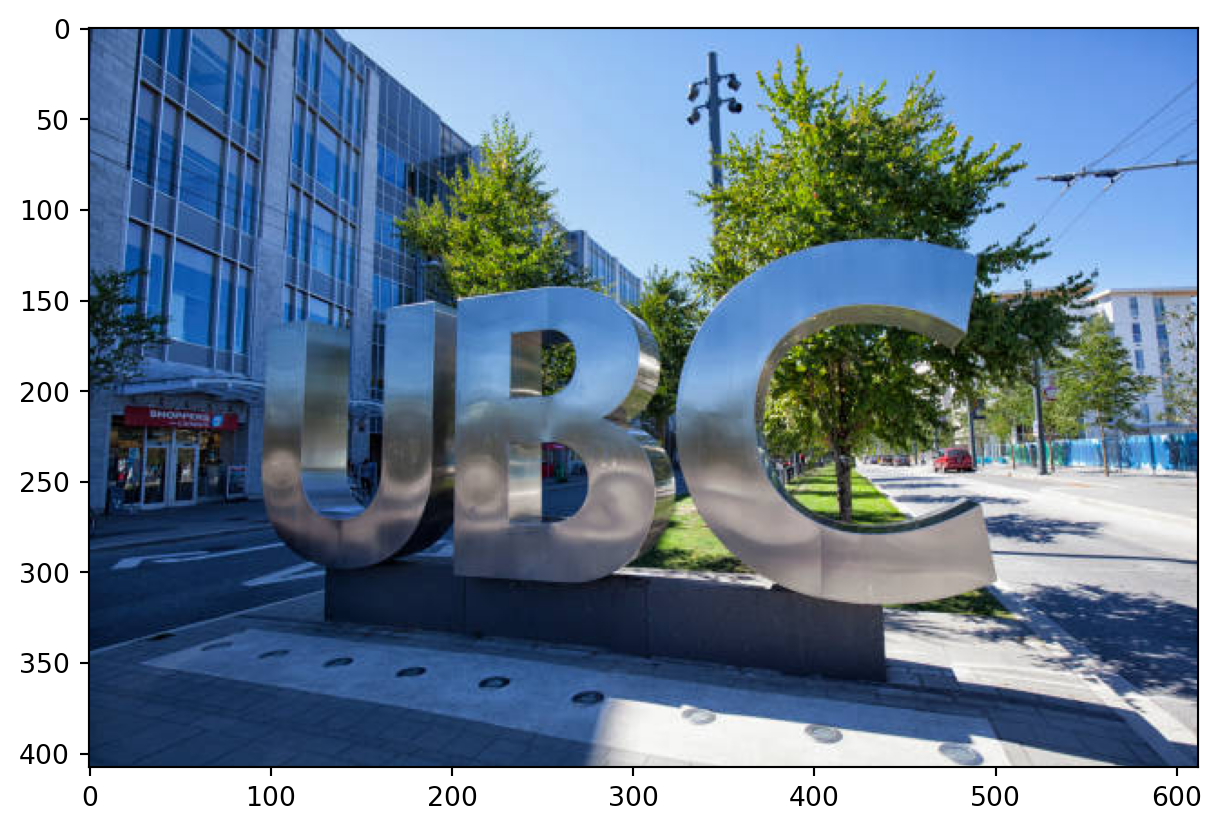
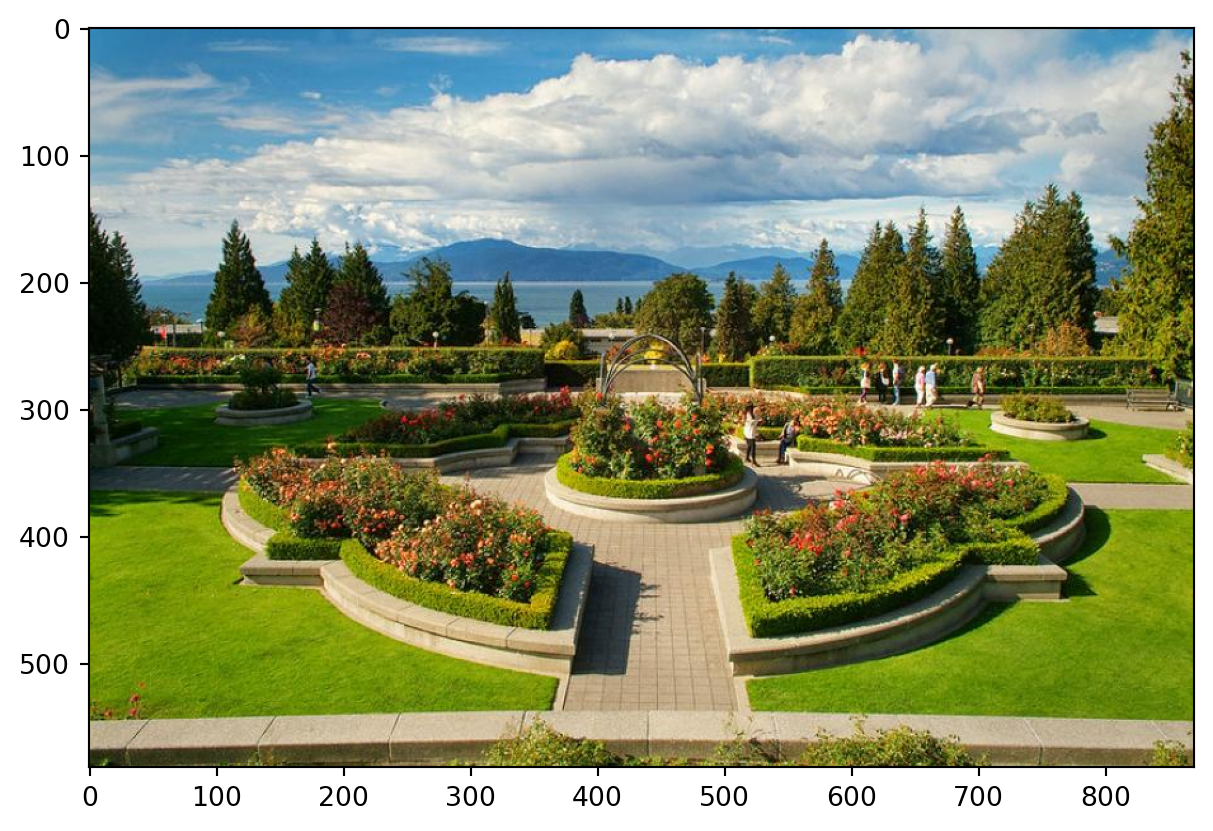
patio, terrace 0.213
fountain 0.164
lakeside, lakeshore 0.097
sundial 0.088
--------------------------------------------------------------Pre-trained models to extract features
- Let’s use pre-trained models to extract features.
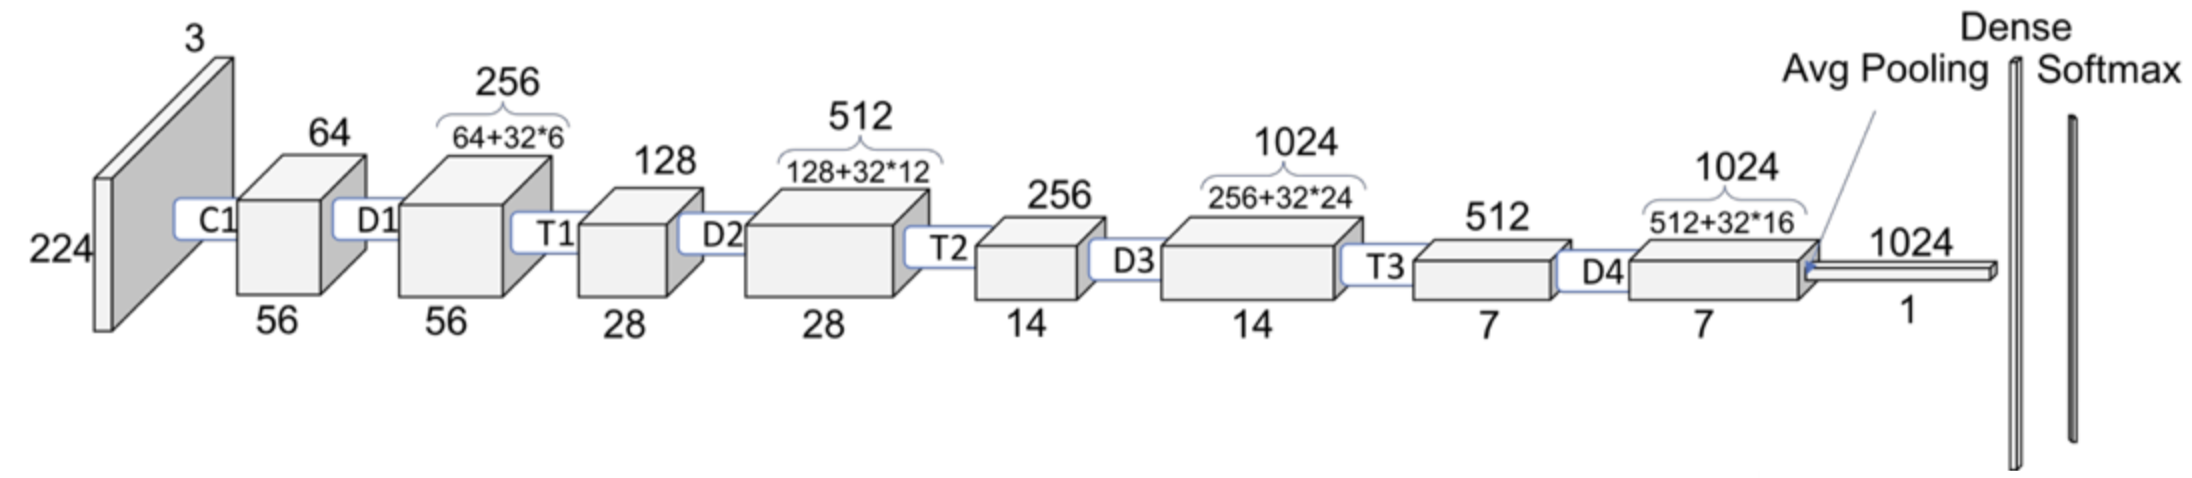
- We will pass our specific data through a pre-trained network to get a feature vector for each example in the data.
- The feature vector is usually extracted from the last layer, before the classification layer from the pre-trained network.
- You can think of each layer a transformer applying some transformations on the input received to that later.
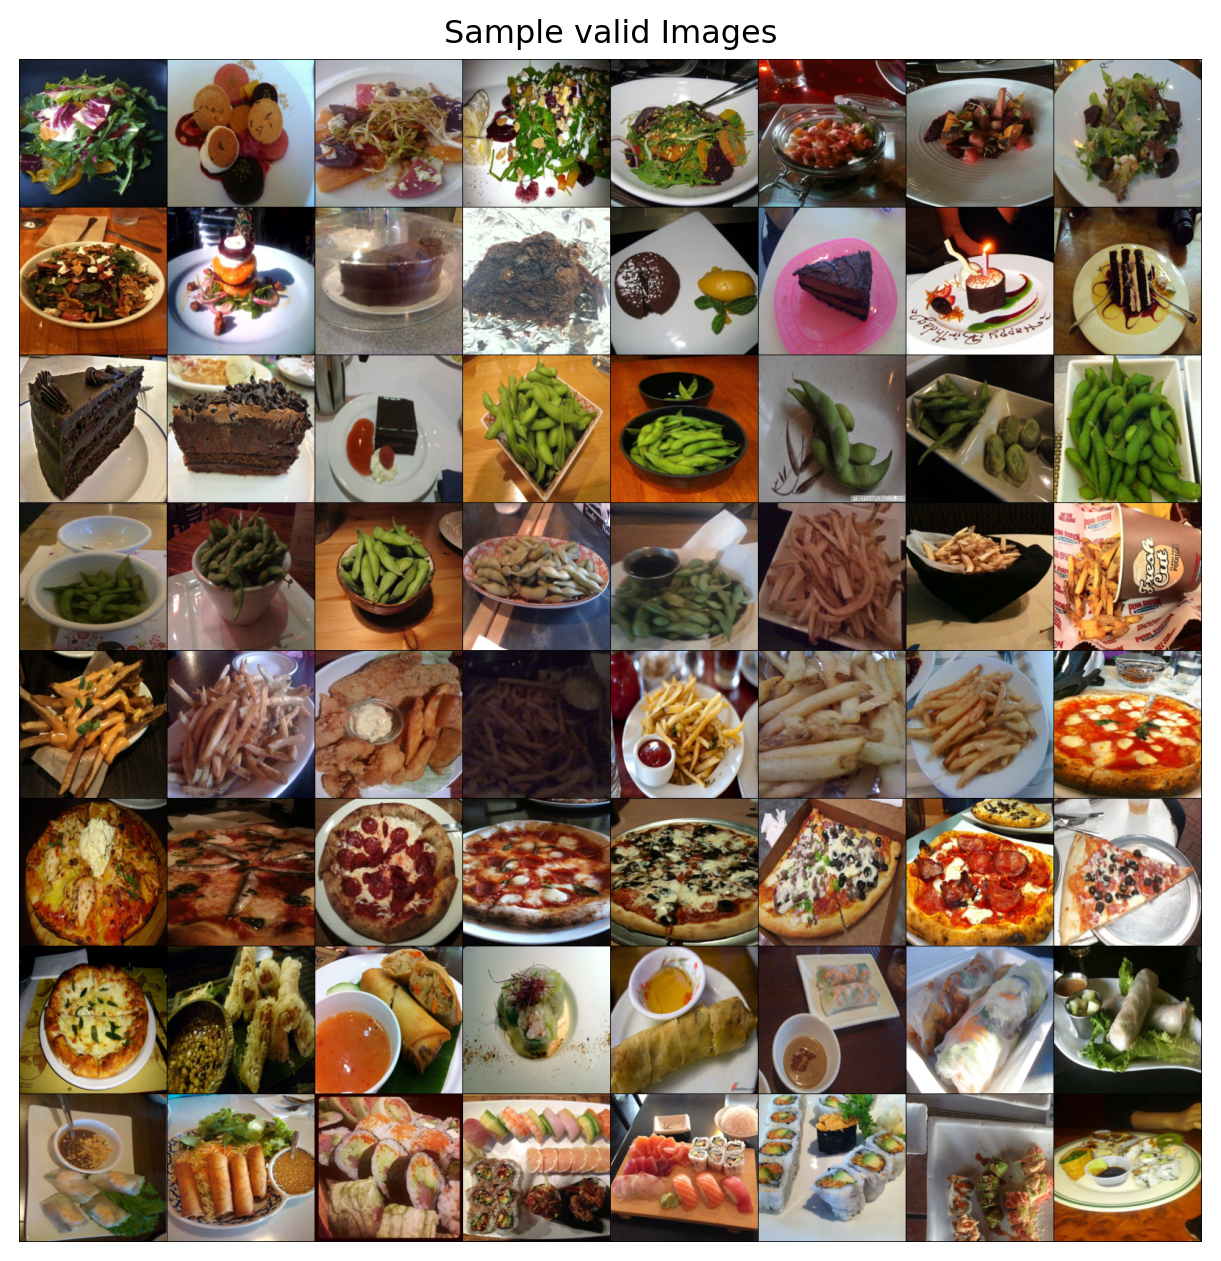
Pre-trained models to extract features
Let’s look at some sample images in the dataset.
Shape of the features
- Now we have extracted feature vectors for all examples. What’s the shape of these features?
torch.Size([283, 1024])- The size of each feature vector is 1024 because the size of the last layer in densenet architecture is 1024.
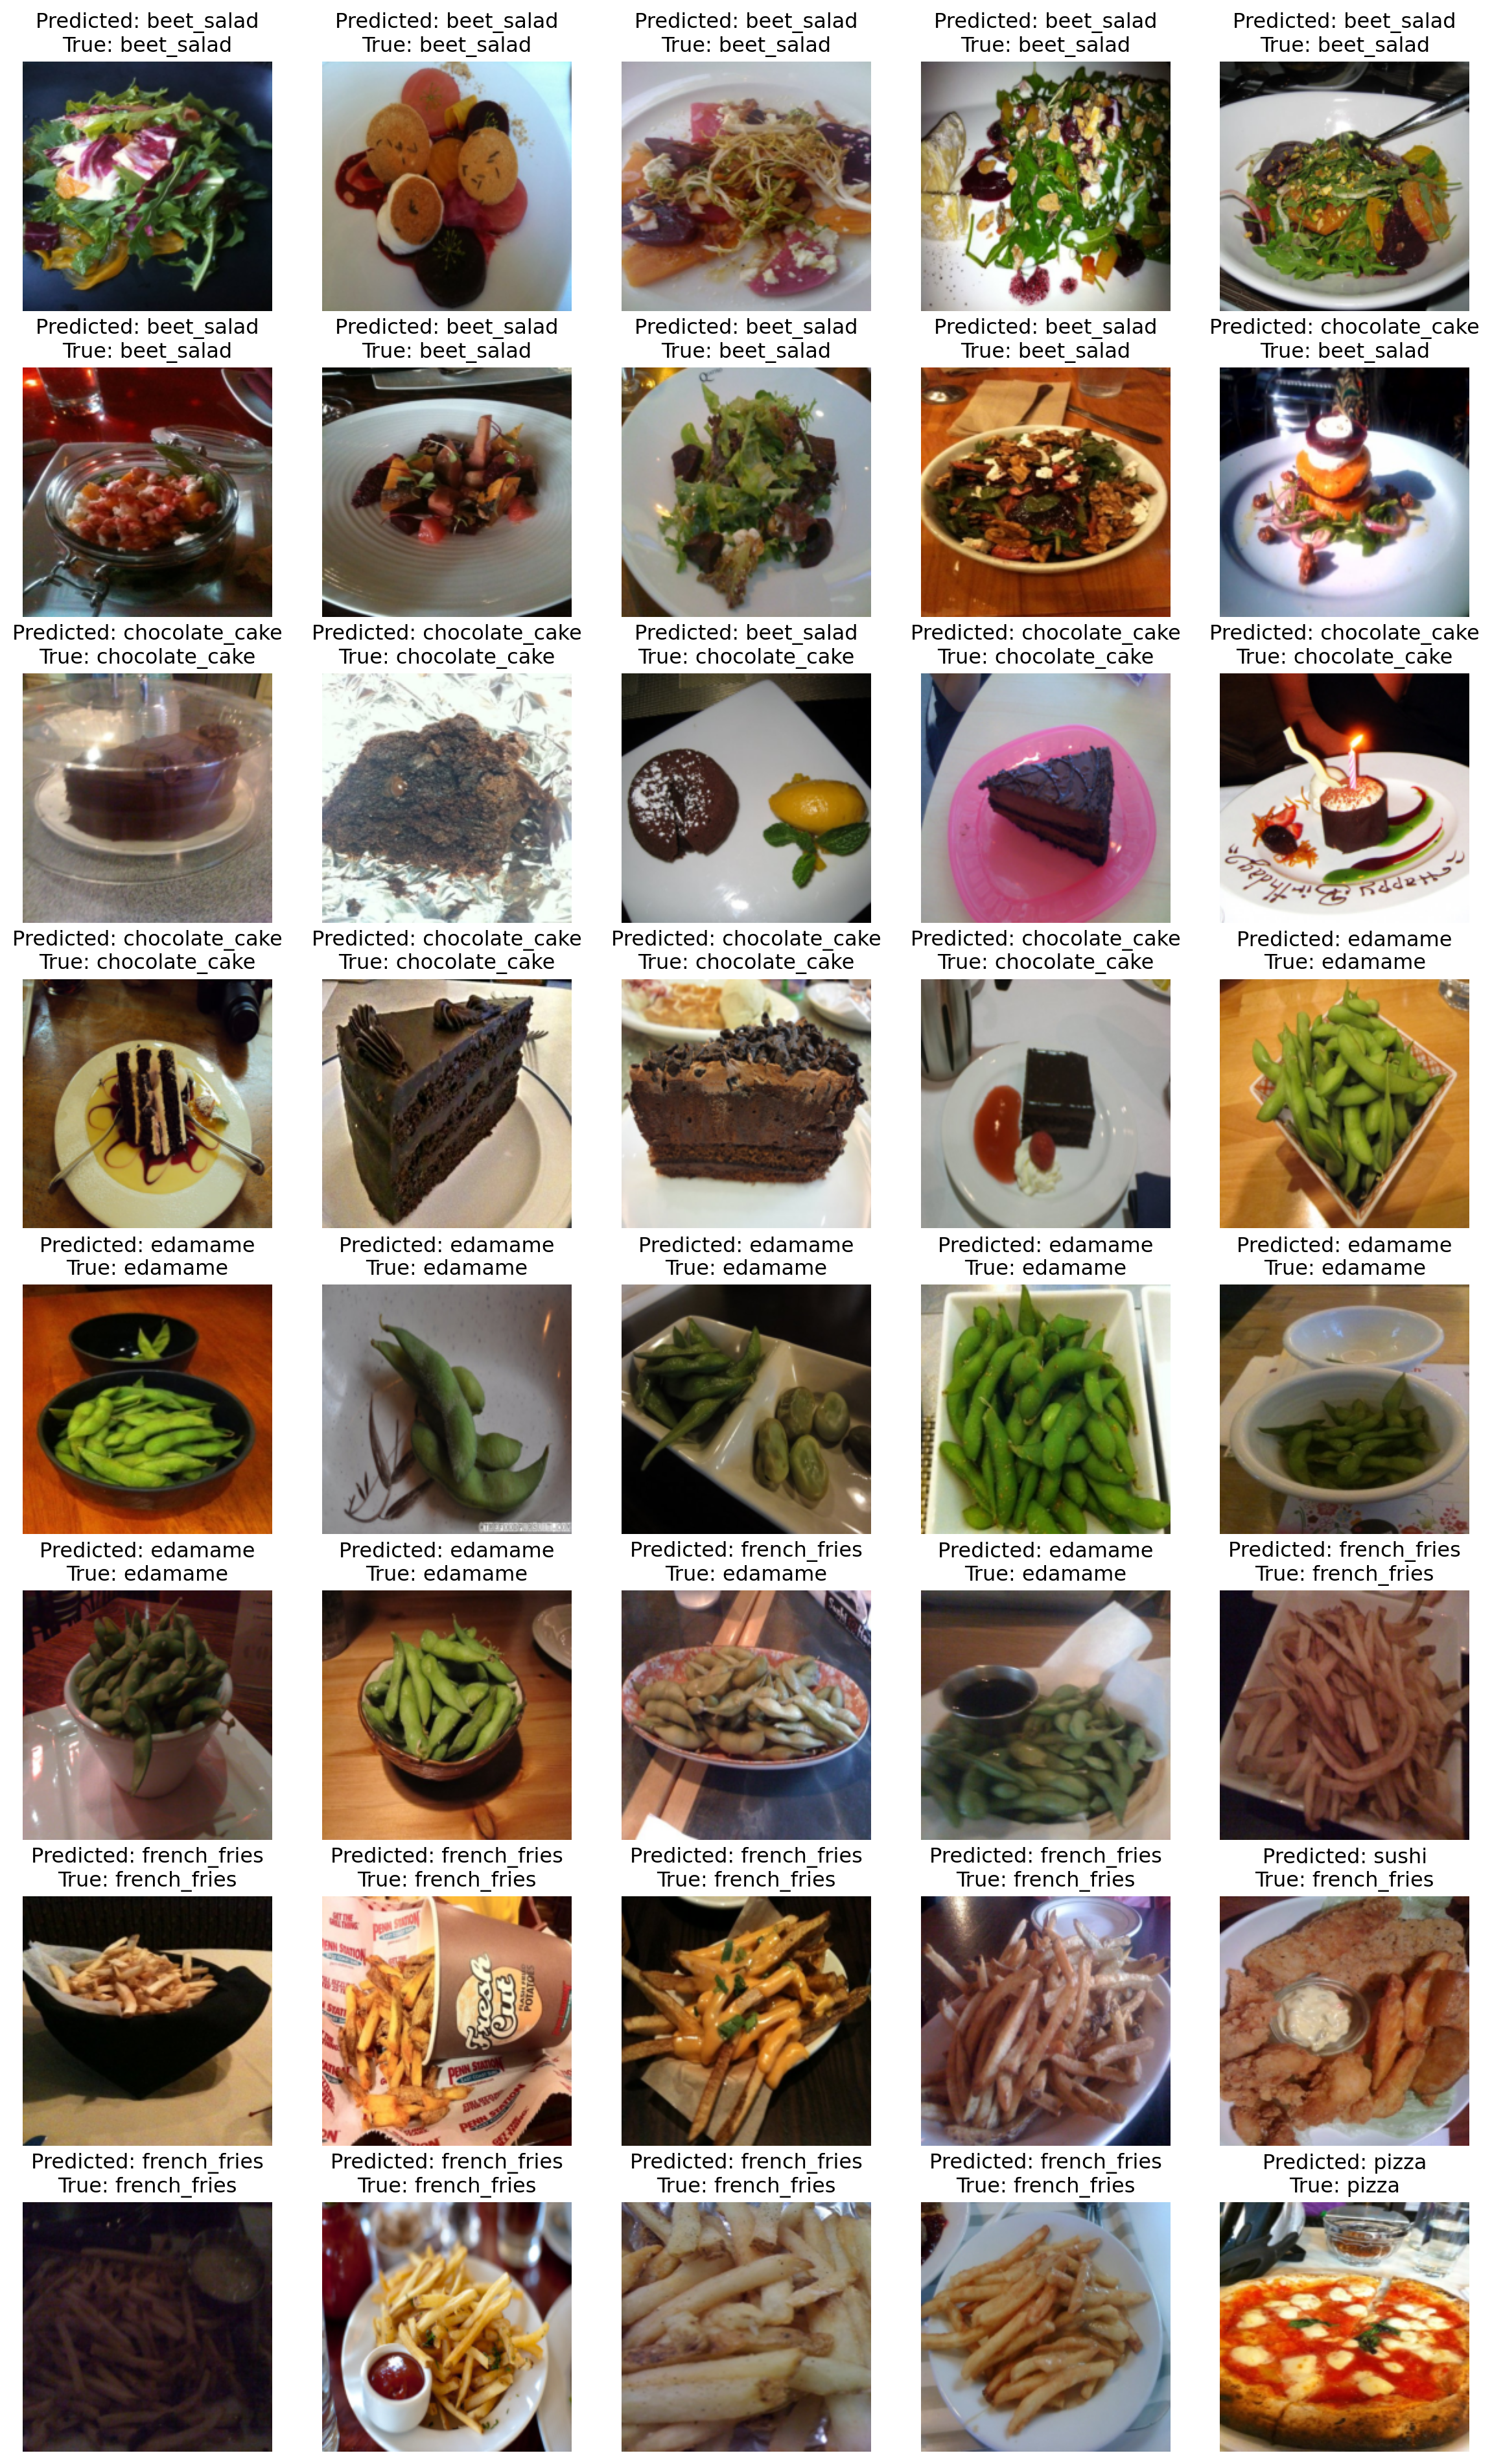
Sample predictions
Let’s examine some sample predictions on the validation set.
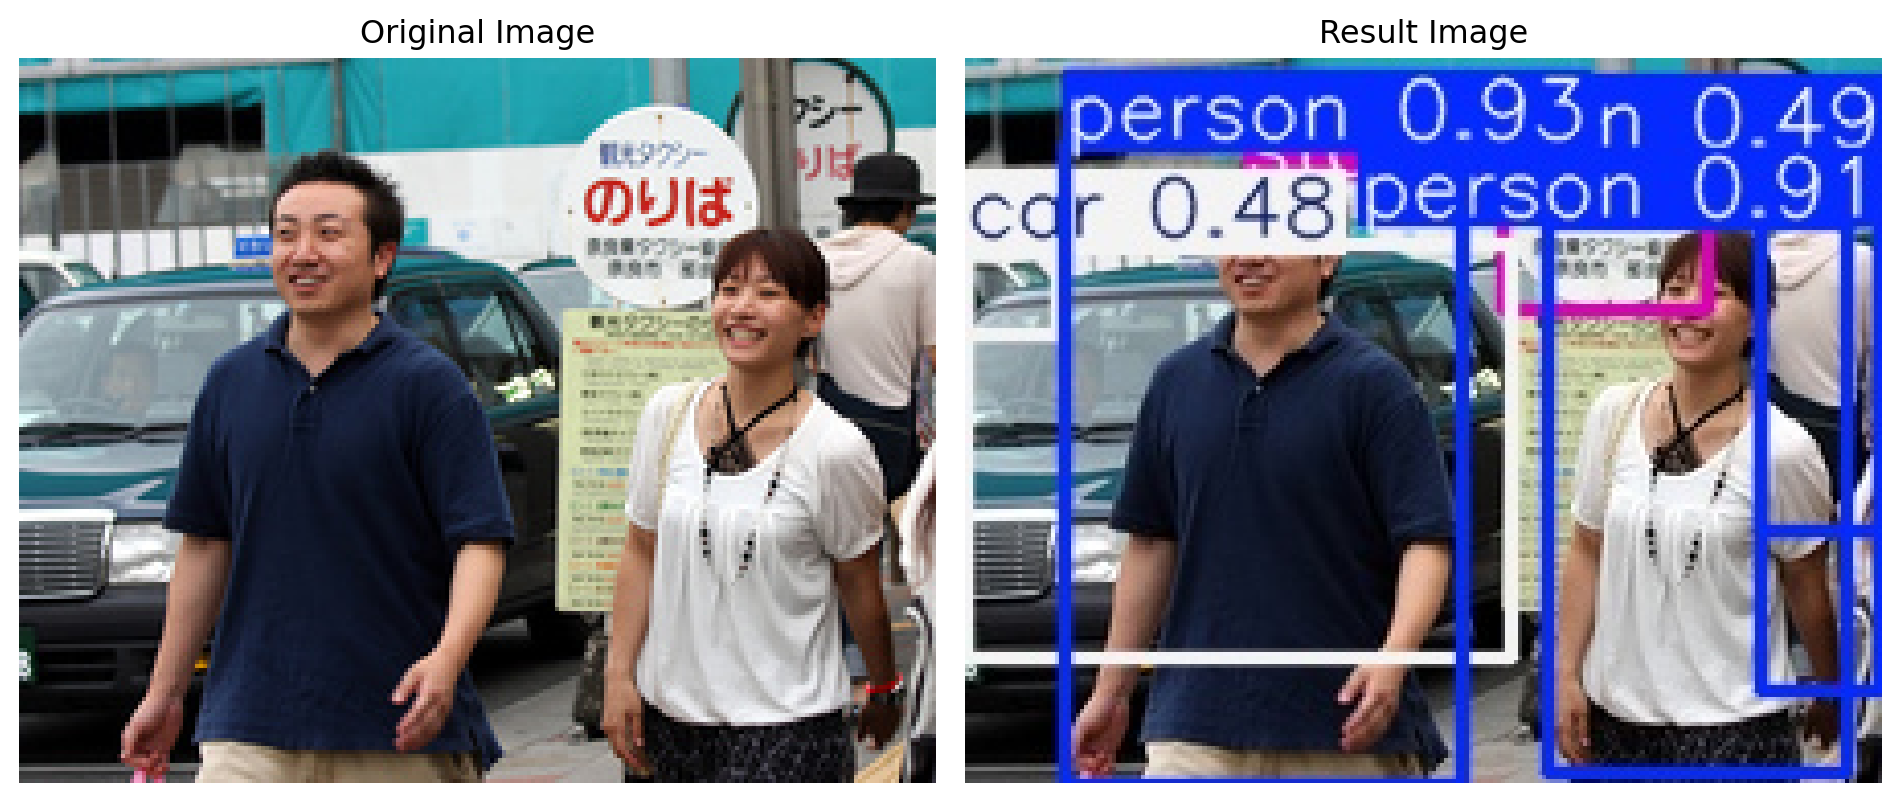
Object detection
- Another useful task and tool to know is object detection using YOLO model.
- Let’s identify objects in a sample image using a pretrained model called YOLO8.
- List the objects present in this image.

Object detection output