CPSC 330 Lecture 11: Ensembles
Focus on the breath!

Announcements
- Midterm next week. Important information about midterm 1
- https://edstem.org/us/courses/104703/discussion/8335467
- Good news for you: You’ll have access to our course notes and sklearn, pandas, and numpy documentation in the midterm!
- HW4 was due Monday, Oct 12 at 11:59 pm.
- HW5 is now available and due Oct 26 at 11:59 pm. This project brings together what you’ve learned. Start early!
Today’s big questions
- When does combining models improve predictions?
- How do random forests and boosting build and combine trees differently?
- How do voting and stacking combine different model types, and when is the extra cost worthwhile?
iClicker Exercise 11.0
Which of the following scenarios has worked effectively for you in the past?
- Working independently on a project/assignment
- Working with like-minded people
- Teaming up with a diverse group offering varied perspectives and skills
The wisdom of crowds
Groups can make better decisions when members contribute useful, different perspectives.
Can averaging help?
A house sells for $500,000.
| Model | Predicted price |
|---|---|
| Linear model | $460,000 |
| Decision tree | $520,000 |
- What is their average prediction?
- What if both models predicted $460,000?
Ensembles: The key idea
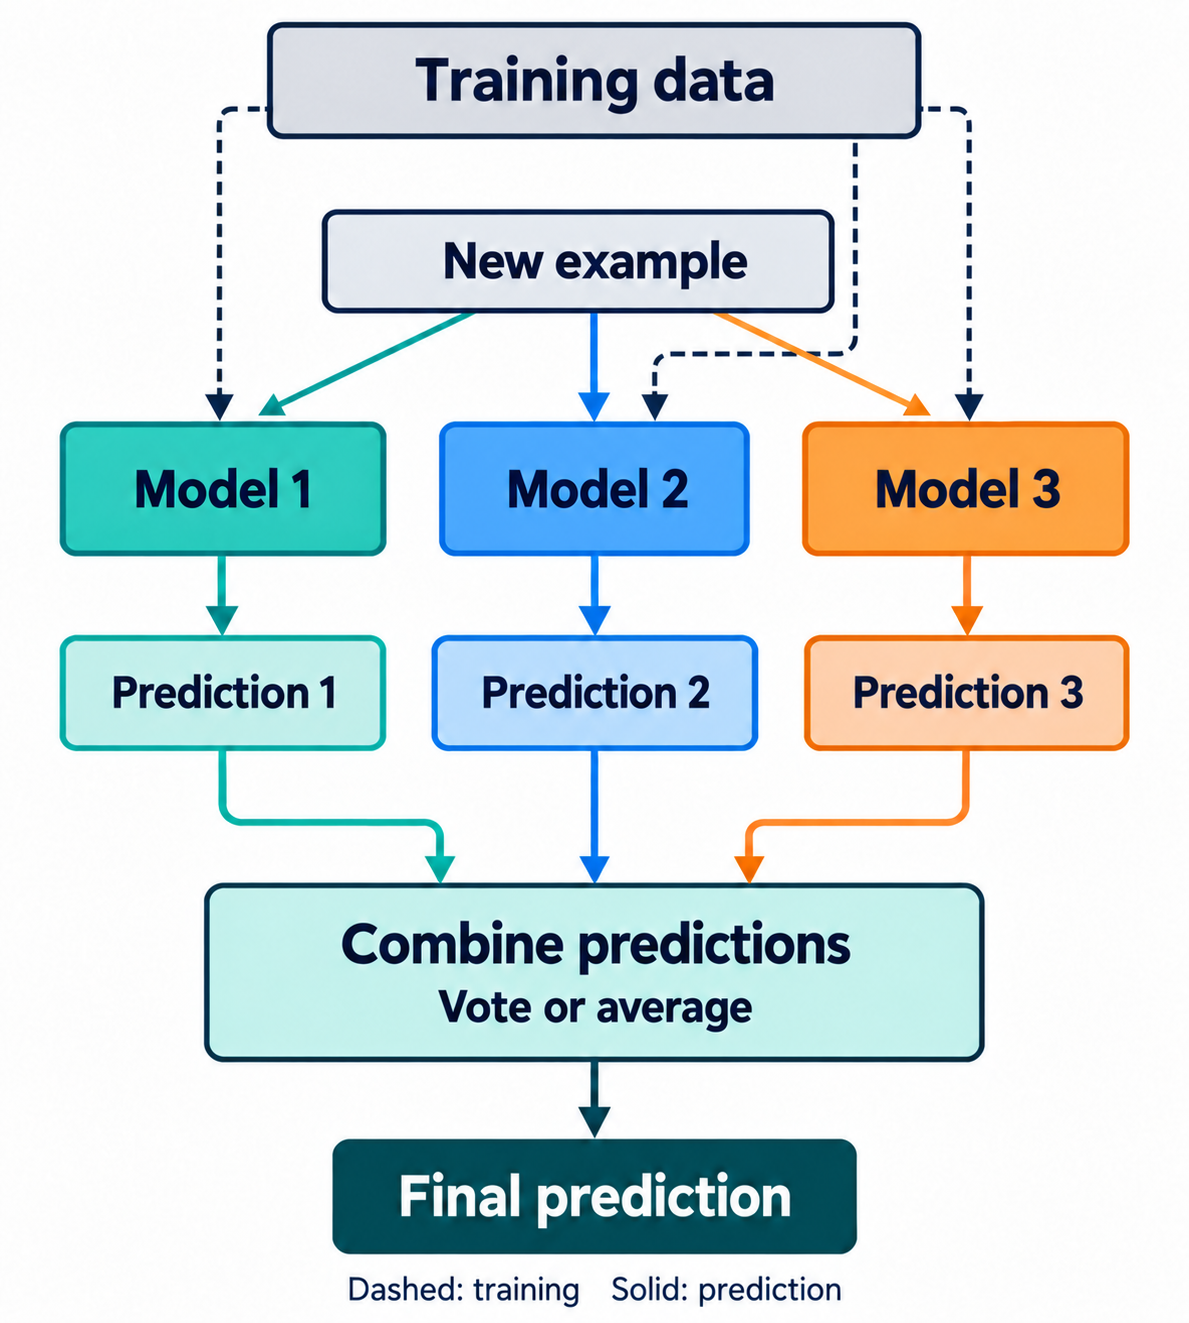
An ensemble combines predictions from multiple models.
- Classification: combine labels or class probabilities
- Regression: average numerical predictions
The aim is better predictions on new examples.
Same accuracy, different mistakes
In a binary classification problem, each model gets 2 of 3 correct. Which ensemble performs better?
✓ Correct and ✗ Wrong
Same mistakes
| Example | Model 1 | Model 2 | Model 3 | Majority vote |
|---|---|---|---|---|
| Example 1 | ✗ | ✗ | ✗ | ✗ |
| Example 2 | ✓ | ✓ | ✓ | ✓ |
| Example 3 | ✓ | ✓ | ✓ | ✓ |
Majority vote: 2/3 correct
Different mistakes
| Example | Model 1 | Model 2 | Model 3 | Majority vote |
|---|---|---|---|---|
| Example 1 | ✗ | ✓ | ✓ | ✓ |
| Example 2 | ✓ | ✗ | ✓ | ✓ |
| Example 3 | ✓ | ✓ | ✗ | ✓ |
Majority vote: 3/3 correct
Diversity alone isn’t enough
In a binary classification problem, each model gets 1 of 3 correct, on a different example. What does the majority vote predict?
✓ Correct and ✗ Wrong
| Example | Model 1 | Model 2 | Model 3 | Majority vote |
|---|---|---|---|---|
| Example 1 | ✓ | ✗ | ✗ | ✗ |
| Example 2 | ✗ | ✓ | ✗ | ✗ |
| Example 3 | ✗ | ✗ | ✓ | ✗ |
Majority vote: 0/3 correct: two wrong predictions outvote one correct prediction on every row.
Useful predictions and different mistakes
- Expertise: individual models learn useful patterns
- Diversity: their errors can offset one another
- Identical predictions gain nothing from averaging
Use validation results to check whether combining models helps.
Today’s methods
- Random forests: train randomized trees independently, then average
- Gradient boosting: build trees sequentially to correct the current ensemble
- Voting and averaging: combine different types of models directly
- Stacking: learn a model that combines base predictions
Random forests
iClicker Exercise 11.1
What could we randomize to build a diverse collection of useful trees? Select all that seem promising.
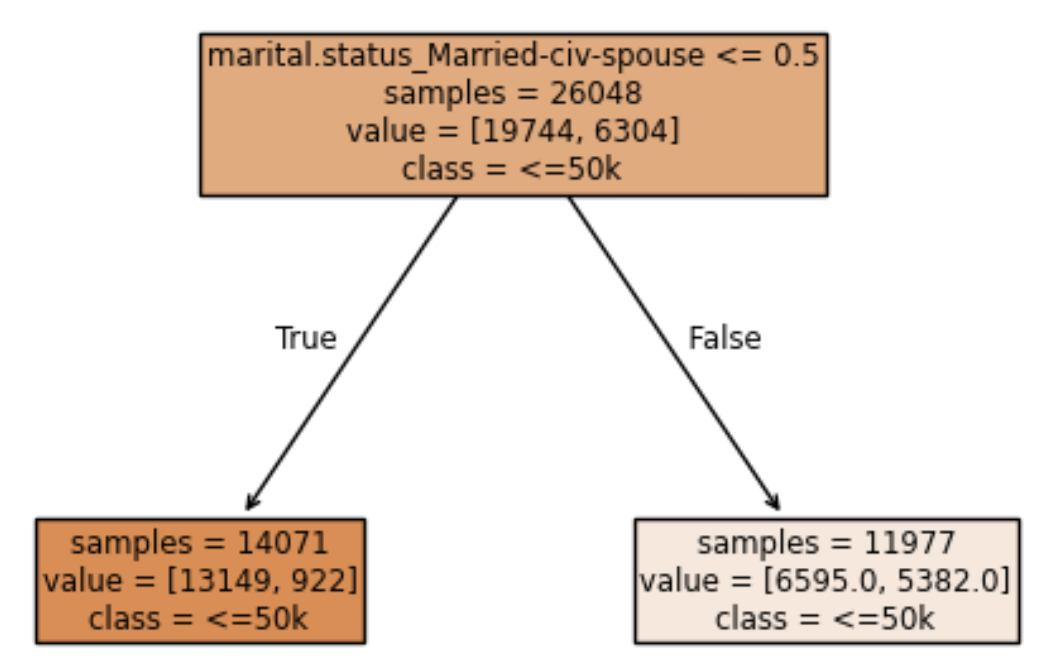
- Which training rows each tree sees
- Which features a split can use
- The thresholds used for splits
- The maximum depth of each tree
- The target labels assigned to training examples
Two sources of randomness
- Bootstrap samples: each tree draws its own training rows, with replacement
- Random feature subsets: each split considers a new random subset of features
Both encourage trees to make different predictions.
Building a training set for each tree
Original training rows: A B C D E F
Each ID represents a complete row: features and target.
- Draw one row: select B
- Put it back: all six rows remain available
- Repeat six times: B B A E B D
| Training row IDs | Repeated IDs | Missing IDs | |
|---|---|---|---|
| Tree 1 | B B A E B D | B (3 times) | C, F |
| Tree 2 | F C C A F D | C, F (twice each) | B, E |
Each tree gets six rows; some repeat and others are absent.
Random features at each split
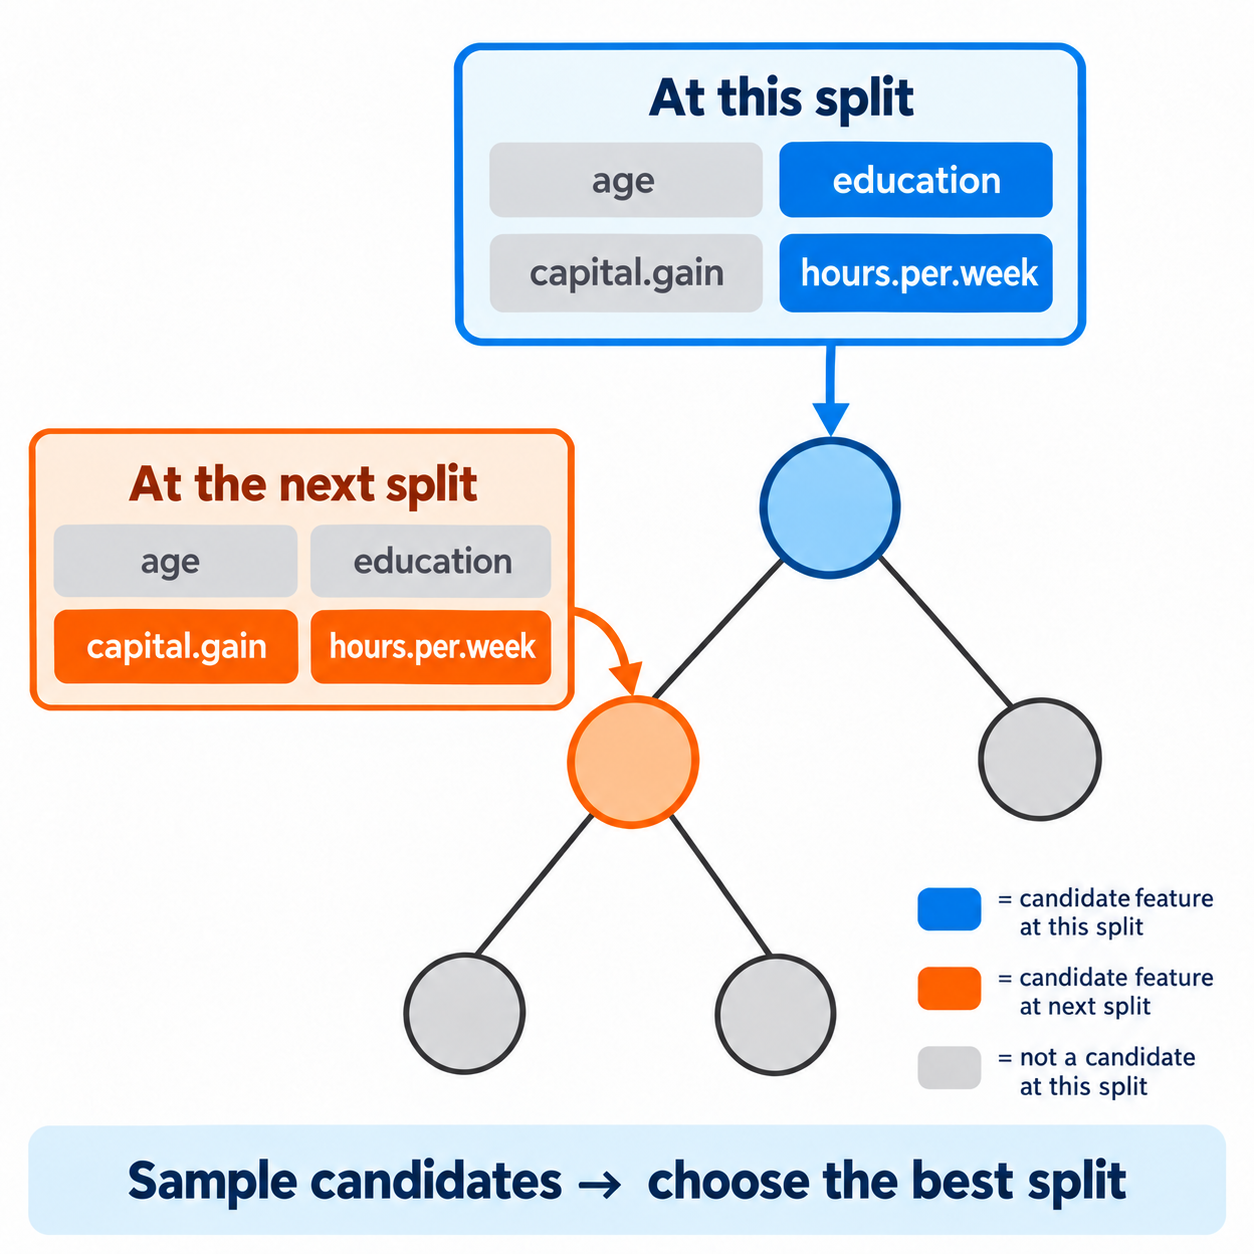
education and hours.per.week at one split, capital.gain and hours.per.week at the next- Sample candidate features at each split
- Choose the best split among those candidates
- An excluded feature can be available at a later split
Why choose a new subset at each split instead of one subset per tree?
Suppose capital.gain is useful but excluded from the candidates at the first split.
- One subset per tree: when could that tree use the feature?
- A new subset per split: what changes?
How a forest predicts
- Classification in scikit-learn: average the trees’ class probabilities; choose the class with the largest average
- Regression: average the trees’ numerical predictions
Trees are trained independently: no tree corrects an earlier tree.
Random-forest hyperparameters
| Hyperparameter | Controls |
|---|---|
n_estimators |
Number of trees in the average |
max_depth |
Maximum depth of each tree |
min_samples_leaf |
Minimum samples supporting a leaf |
max_features |
Candidate features considered at each split |
Fewer candidate features encourage diversity but can weaken individual trees.
More trees versus deeper trees
- Deeper trees can fit finer details, including noise
- More trees stabilize the average from the same training procedure
- Gains from more trees often level off; computation and memory keep growing
Adding trees does not automatically fix a training–validation gap.
iClicker Exercise 11.2
Select the most accurate statement about a standard random forest.
- Each tree independently draws a bootstrap sample of the training rows
- Each tree is restricted to one randomly selected feature subset throughout training
- Choose
n_estimatorsusing whichever value scores best on the reserved test set
- Choose
- Each tree learns to correct the predictions of the previous tree
- Averaging cannot outperform the most accurate individual model
Demo
Go to the Demo
- Trace a prediction through the small forest
- Compare the tree and forest on the same validation folds
- Inspect accuracy and fit time as the forest grows
Does the gain justify the extra computation?
Gradient boosting
Random forests and boosting
| Random forests | Gradient boosting |
|---|---|
| Train trees independently | Train trees sequentially |
| Average predictions | Add learned corrections |
| Randomness encourages different trees | Each tree improves the current ensemble |
Both require validation; neither guarantees better generalization.
Boosting example: One starting prediction
Predict house price from floor area, using squared-error loss. Prices are in thousands of dollars; these are invented training data.
Start by predicting the mean price, 280, for every house.
| Floor area | Actual price | Starting prediction | Residual: actual − prediction |
|---|---|---|---|
| 50 | 200 | 280 | −80 |
| 70 | 220 | 280 | −60 |
| 90 | 260 | 280 | −20 |
| 110 | 300 | 280 | +20 |
| 130 | 340 | 280 | +60 |
| 150 | 360 | 280 | +80 |
Where should we lower predictions? Where should we raise them?
Boosting example: Learn a correction
Fit a one-split tree: input = floor area; target = residual. It splits at floor area 100 and predicts each group’s mean residual.
| Houses | Residuals | Tree’s correction |
|---|---|---|
| Area ≤ 100 | −80, −60, −20 | −53.3 |
| Area > 100 | +20, +60, +80 | +53.3 |
With learning rate 0.5, apply half the correction:
| Houses | Updated prediction |
|---|---|
| Area ≤ 100 | 280 − 26.7 = 253.3 |
| Area > 100 | 280 + 26.7 = 306.7 |
Repeat: compute the remaining errors and fit the next correction tree.
Controlling boosting complexity
- Rounds: how many corrections we add
- Learning rate: how much of each correction we apply
- Tree size: how complex each correction can be
Tune these together using validation data.
More rounds can overfit; smaller steps may need more rounds.
Gradient-boosted tree implementations
| Implementation | Useful distinction |
|---|---|
| scikit-learn | Classic and histogram-based implementations |
| XGBoost | Efficient tree building and explicit regularization |
| LightGBM | Histogram splits and leaf-wise tree growth |
| CatBoost | Built-in handling of categorical features |
Compare on your task; no library is a universal winner.
Demo: Compare boosting candidates
Use the same training data, validation folds, and metric.
- Compare against the single tree and random forest
- Read validation scores alongside fold-to-fold variation
- Compare fit and prediction costs
A small score difference may not justify a much slower model.
Voting, averaging, and stacking
Combining different model types
For example: logistic regression + random forest + boosted trees.
- Classification: combine labels or probabilities
- Regression: average numerical predictions
- Different model types can encourage complementary errors
Check the combination against its strongest individual model.
Hard and soft voting
Hard voting
- Combine predicted labels
- Choose the class with the most votes
Soft voting
- Average class probabilities
- Choose the class with the largest average
Can hard and soft voting disagree?
Three binary classifiers predict these positive-class probabilities:
| Model A | Model B | Model C |
|---|---|---|
| 0.51 | 0.51 | 0.01 |
- Which class wins the hard vote at a 0.5 threshold?
- Which class wins the soft vote?
- Is using probabilities always better?
Stacking: Learn the combination
Base predictions become features for a meta-model.
Illustrative training inputs: each model supplies \(P(\text{income} > 50K)\).
| Logistic regression | Random forest | LGBM | Target | |
|---|---|---|---|---|
| 0 | 0.34 | 0.40 | 0.10 | ≤50K |
| 1 | 0.72 | 0.65 | 0.85 | >50K |
| 2 | 0.48 | 0.55 | 0.30 | ≤50K |
| 3 | 0.20 | 0.65 | 0.80 | >50K |
- Inputs: the three probability columns, using out-of-fold predictions
- Target: the original income label; index is only a row identifier
- For a new row, the meta-model predicts from the base probabilities
Train the meta-model on held-out predictions
- Split the training data into folds
- Fit each base pipeline on the other folds; predict the held-out fold
- Repeat until every training row has out-of-fold predictions
- Fit the meta-model on those predictions and the training labels
Each row’s inputs come from base models fitted without that row.
Refit base pipelines on all training data. For a new row, pass their predictions to the trained meta-model.
Evaluating the whole stack
- Evaluate the complete training procedure on held-out data
- Keep evaluation rows out of base-model and meta-model fitting
- Compare with voting and the strongest individual candidate
Stacking adds fitting cost; improvement is not guaranteed.
Demo: Does combining models help?
- Compare voting and stacking with their constituent models
- Inspect their probability calculations and validation results
- Weigh any gain against training, prediction, and maintenance costs
Keep the ensemble only when the evidence supports it.
Comparing ensemble methods
| Method | Training | Prediction |
|---|---|---|
| Random forest | Independent randomized trees | Average probabilities or numbers |
| Gradient boosting | Successive correction trees | Add scaled corrections |
| Voting / averaging | Separate base models | Vote or average |
| Stacking | Base models + meta-model trained on held-out predictions | Pass base predictions to meta-model |
All have classification and regression versions.
Key takeaways
- Useful, complementary predictions make ensembles promising
- More forest trees stabilize an average; more boosting rounds add corrections
- Stacking needs held-out base predictions for meta-model training
- Choose using validation performance and practical cost
Ensembles class demo