CPSC 330 Lecture 13: Feature engineering and selection
Focus on the breath!

Announcements
- HW5 extension
iClicker
How did you feel about the exam ?
- I felt well-prepared and it went smoothly
- I think it went okay. We’ll see when grades come back
- I struggled and didn’t feel fully prepared
- I noticed some gaps between what we practiced and what appeared on the exam
- It was a stressful experience for me 😔
Today’s big questions
- How can changing the features help a model learn?
- What do interaction features let a linear model express?
- When might we want fewer features?
- How do model-based selection and RFE work, and how do we evaluate them?
Give the model useful inputs
Design a feature: flight delays
Suppose we want to predict, before departure, whether a flight will arrive on time or be delayed. Our dataset includes:
- Scheduled departure time
- Expected flight duration (in minutes)
In the training data, flights scheduled to depart during the evening rush (4–7 p.m.) are delayed more often.
With a neighbour: What feature could we create from these inputs to help the model capture this pattern?
Feature engineering: change the representation
Add “scheduled departure is during rush hour”:
| Flight | Departure hour | Rush-hour indicator |
|---|---|---|
| A | 8 | 0 |
| B | 17 | 1 |
| C | 22 | 0 |
- The model can now assign an extra contribution to rush-hour flights.
- We added no new measurement; we made a pattern easier to represent.
- This is feature engineering. Check whether it helps using validation data.
Three different questions
| Idea | Question |
|---|---|
| Feature importance (lecture 12) |
How does a fitted model use its inputs? |
| Feature engineering | Could a different representation help the model? |
| Feature selection | Which subset of inputs should we keep? |
Today: propose a representation or subset, refit, and compare validation performance.
Interaction features
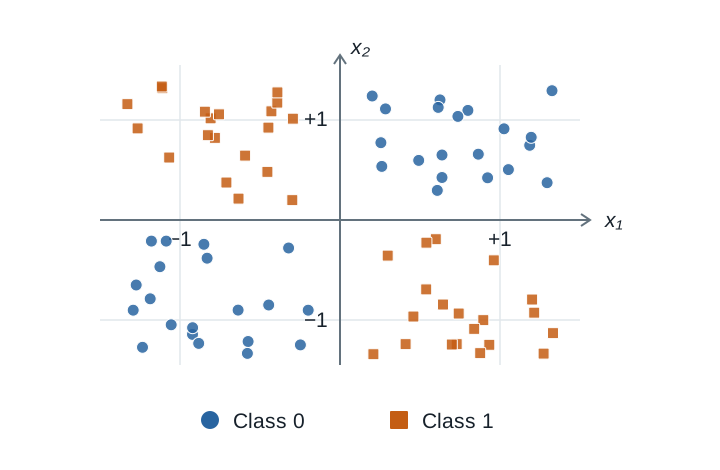
Can a straight line separate these classes?
Can you draw one straight line with all blue circles on one side and all orange squares on the other?
Build a feature that exposes the pattern
Complete the product column. What rule separates the classes now?
| \(x_1\) | \(x_2\) | \(x_1x_2\) | Target |
|---|---|---|---|
| −1 | −1 | ? | 0 |
| +1 | −1 | ? | 1 |
| −1 | +1 | ? | 1 |
| +1 | +1 | ? | 0 |
An interaction captures a combination
Add the product to a linear classifier’s score:
\[s = b + w_1x_1 + w_2x_2 + w_{12}x_1x_2.\]
- The model is still linear in its supplied features.
- Its boundary can be nonlinear in the original inputs.
- The effect of \(x_1\) can now depend on \(x_2\).
- Trees can already represent interactions through successive splits.
Class demo: interaction features
Feature engineering and selection notebook
Compare logistic regression with and without the product feature.
Before running: Which model should do better on XOR?
After running: What changed—the data we measured, or the representation?
Interactions between categories
We predict parking availability from location and time.
| Location | 9 a.m. | 7 p.m. |
|---|---|---|
| UBC campus | ? | ? |
| Rogers Arena | ? | ? |
Discuss (60 seconds): Would “7 p.m.” have the same effect at both locations? Propose a feature for one specific combination.
For example, create location AND time indicators:
| Location | Time | UBC AND 9 a.m. | Rogers Arena AND 7 p.m. |
|---|---|---|---|
| UBC campus | 9 a.m. | 1 | 0 |
| UBC campus | 7 p.m. | 0 | 0 |
| Rogers Arena | 9 a.m. | 0 | 0 |
| Rogers Arena | 7 p.m. | 0 | 1 |
iClicker: what did the interaction add?
Logistic regression improves on XOR after we add \(x_1x_2\). Choose the best explanation.
- We collected a new measurement.
- The pattern becomes separable by a linear classifier in the transformed space.
- Adding any feature must improve validation performance.
- The interaction must help every model equally.
Other ways to represent numeric inputs
Counts or ratios?
Each row describes a California census block group.
| Block group | Total rooms | Households | Rooms per household |
|---|---|---|---|
| A | 4,000 | 1,000 | 4 |
| B | 2,000 | 200 | 10 |
Which has more rooms? Which has more rooms per household?
Would you use the counts, the ratio, or both to predict median house value?
Binning: let different ranges have different effects
- A continuous input in ridge regression has a constant slope, holding other inputs fixed.
- Binning + one-hot encoding gives each interval its own coefficient.
- Values in the same bin receive the same contribution; adjacent bins can differ.
| Rooms per household | Bin indicator |
|---|---|
| 4.01 | Bin A |
| 4.09 | Bin A |
| 4.10 | Bin B |
Does a larger value have to give a larger prediction?
Class demo: numeric feature engineering
Return to feature engineering with numeric features in the notebook.
- Inspect rooms per household alongside the original counts.
- Compare continuous and binned inputs for ridge regression.
- Inspect the bin coefficients.
Predict before running: Will a more flexible representation always improve validation performance?
Do we need every feature?
Why consider feature selection?
Interactions and bins can create many columns. Some may be irrelevant or redundant.
Keeping a subset may help us:
- Reduce opportunities to fit noise.
- Reduce fitting and prediction costs.
- Inspect a smaller model.
- Avoid collecting expensive measurements—if we can drop the original measurement entirely.
Removing features can also discard useful information.
Low importance: safe to delete?
Two related features have low permutation importance in the current model.
A teammate proposes removing both.
Discuss (60 seconds): What could go wrong? What comparison would you run before agreeing?
Model-based selection: one importance threshold
- Fit a selection model that provides feature importances or coefficients.
- Keep features whose importance reaches a chosen threshold.
- Fit the final predictor using the retained columns.
Example: random forest selects columns → logistic regression predicts.
The selection model and final predictor can be different.
Keep selection inside the pipeline
Training fold:
Preprocess → fit selector and retain columns → fit predictor
Validation fold:
Apply fitted preprocessing → retain the same columns → predict and score
Class demo: model-based selection
Return to model-based selection in the notebook.
- Compare an all-features baseline with a selection pipeline.
- Inspect which columns remain and how many are retained.
- Compare validation performance and fitting cost.
Before running: Is a smaller feature set guaranteed to score better?
RFE: remove, refit, repeat
Recursive feature elimination (RFE) chooses a subset through repeated fitting.
- Choose how many features to retain, \(k\).
- Fit the estimator on the remaining features.
- Remove the least important feature(s).
- Refit and repeat until \(k\) remain.
Importances can change after each removal.
Trace one RFE step
We want two features. The current estimator gives these importances:
| Feature | A | B | C | D |
|---|---|---|---|---|
| Importance | 0.50 | 0.30 | 0.15 | 0.05 |
With one feature removed per step:
- Which feature goes first?
- Can we already conclude that C goes next? Why?
Model-based selection versus RFE
| Model-based selection | RFE | |
|---|---|---|
| Decision rule | Importance threshold | Repeatedly remove least important |
| Selection fitting | One fit for a given threshold | Refit after each removal round |
| Main setting | Threshold | Number to retain; removal step |
| Guarantee of best subset? | No | No |
Both depend on the estimator, data, and other available features.
Class demo: RFE
Return to recursive feature elimination in the notebook.
- Inspect the retained features and
ranking_. - Compare validation performance with model-based selection and all features.
- Discuss the cost of fitting repeatedly.
How many features should we retain? Treat the count as a hyperparameter and choose it using cross-validation.
iClicker: find the leakage
A student fits SelectFromModel on all labelled data, keeps its selected columns, then cross-validates logistic regression on the reduced matrix.
Is this evaluation valid? Choose one.
- Yes: logistic regression never fits on validation targets.
- Yes: the selector is only a transformation.
- No: every fold must select different features.
- No: validation targets helped select the columns before cross-validation.
Choose features by evaluating the workflow
- Compare engineered features and selected subsets with a baseline.
- Fit learned preprocessing and selection inside each training fold.
- Tune thresholds or feature counts using cross-validation.
- Keeping all features is a legitimate outcome.
- Use the test set once the workflow is fixed.
Today’s takeaways
- Feature engineering changes the representation; interactions let effects depend on combinations of inputs.
- Feature selection keeps a subset; it can help or hurt predictive performance.
- Model-based selection applies a threshold; RFE removes and refits repeatedly.
- Evaluate the whole pipeline, including feature decisions.
Exit question
A new interaction improves training accuracy but lowers mean cross-validation accuracy.
Write one sentence: Would you keep it, and what evidence supports your decision?