CPSC 330 Lecture 15: DBSCAN, Hierarchical Clustering
Focus on the breath!

Imports
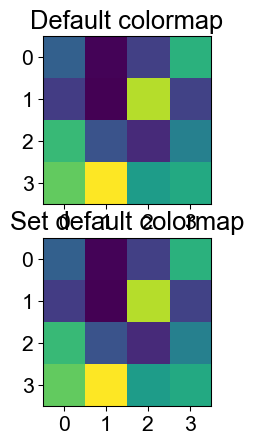
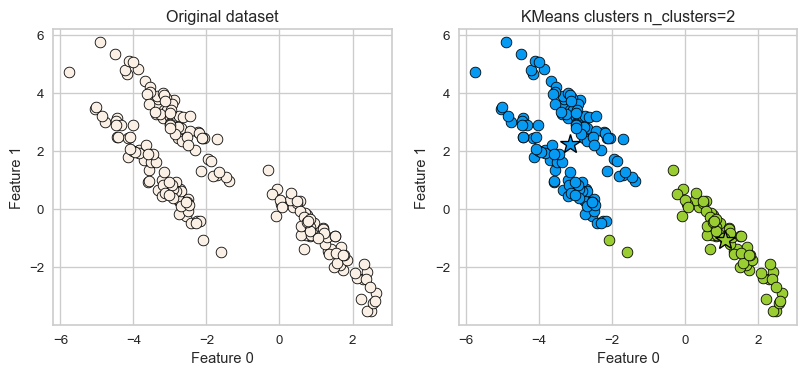
Shape of clusters
- Good for spherical clusters of more or less equal sizes
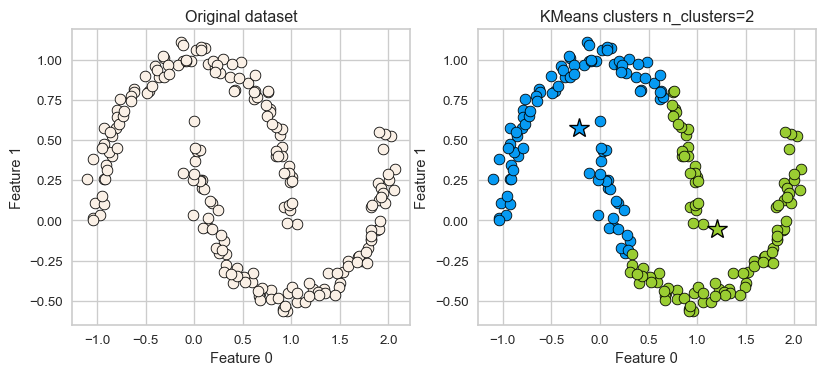
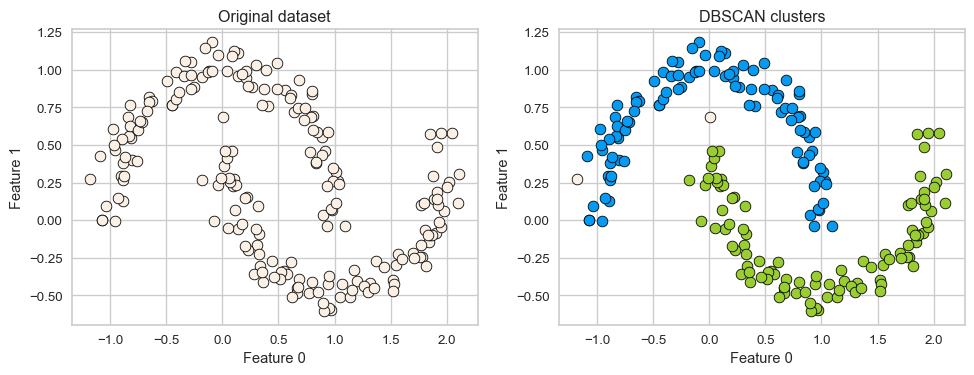
K-Means: failure case 1
- K-Means performs poorly if the clusters have more complex shapes (e.g., two moons data below).
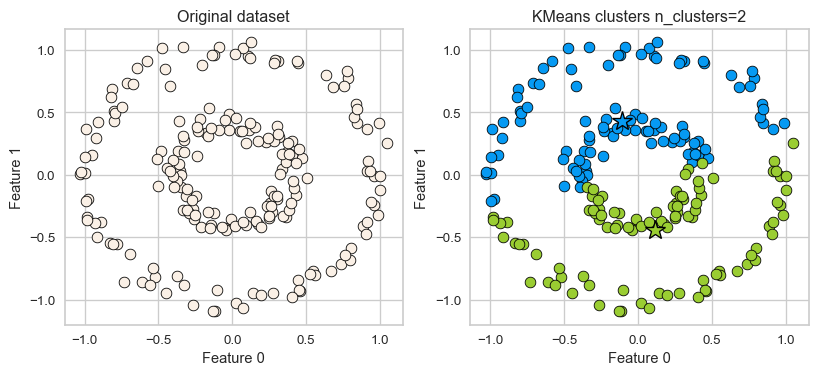
K-Means: failure case 2
- Again, K-Means is unable to capture complex cluster shapes.
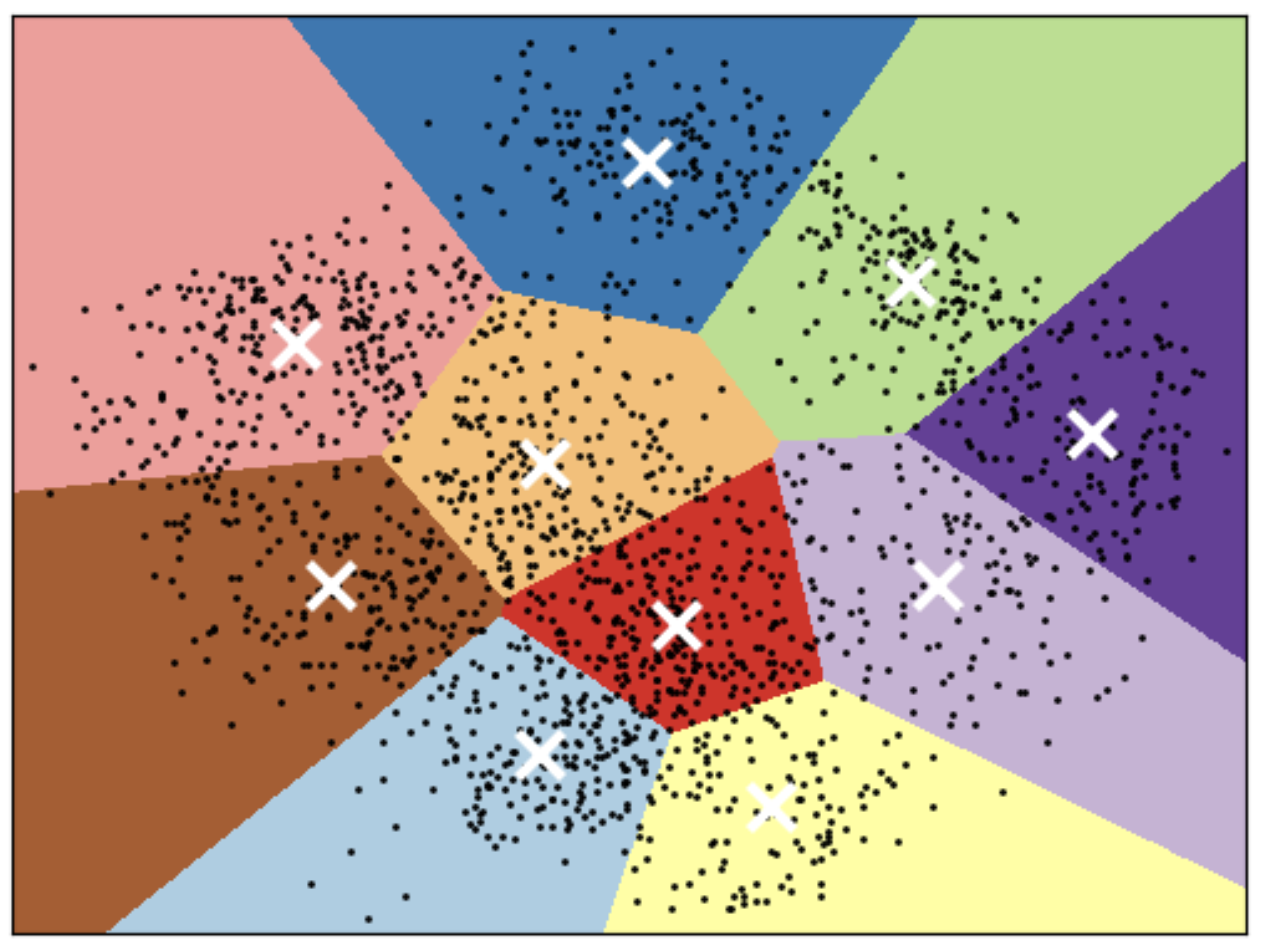
K-Means: failure case 3
- It assumes that all directions are equally important for each cluster and fails to identify non-spherical clusters.
DBSCAN
- Density-Based Spatial Clustering of Applications with Noise
- A density-based clustering algorithm
DBSCAN analogy
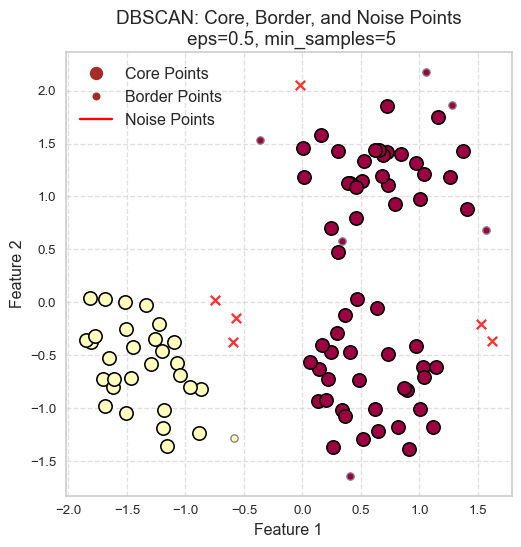
Consider DBSCAN in a social context:
- Social butterflies (🦋): Core points
- Friends of social butterflies who are not social butterflies: Border points
- Lone wolves (🐺): Noise points
DBSCAN algorithm
- Pick a point \(p\) at random.
- Check whether \(p\) is a “core” point or not.
- If \(p\) is a core point, give it a colour (label).
- Spread the colour of \(p\) to all of its neighbours.
- Check if any of the neighbours that received the colour is a core point, if yes, spread the colour to its neighbors as well.
- Once there are no more core points left to spread the colour, pick a new unlabeled point \(p\) and repeat the process.
DBSCAN: failure cases
- Let’s consider this dataset with three clusters of varying densities.
- K-Means performs better compared to DBSCAN. But it has the benefit of knowing the value of \(K\) in advance.
[ 0 1 2 3 4 5 6 7 8 9 10 11 12 13 14 15]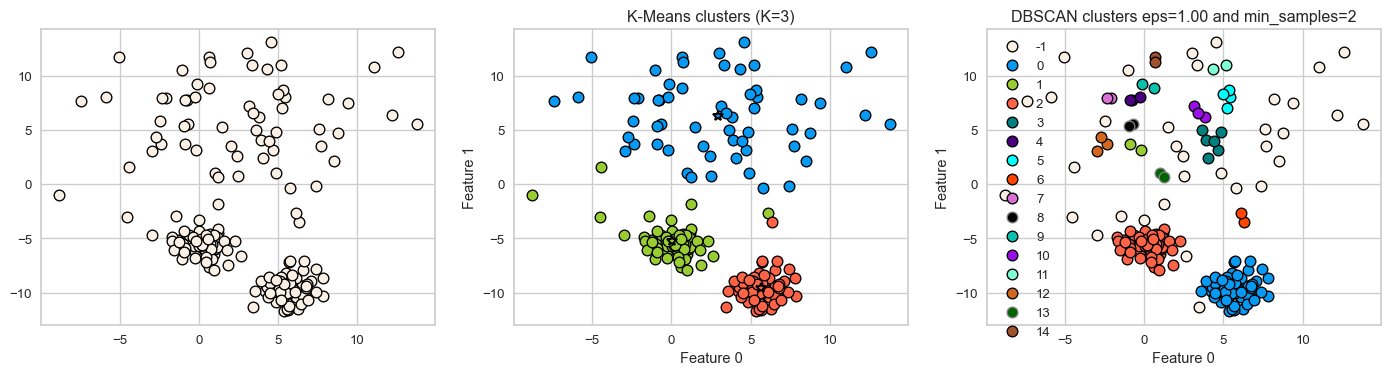
Hierarchical clustering
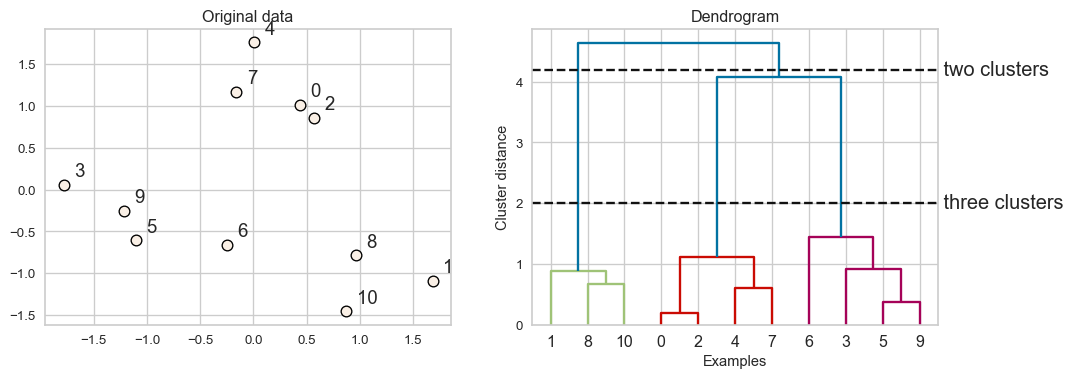
Dendrogram
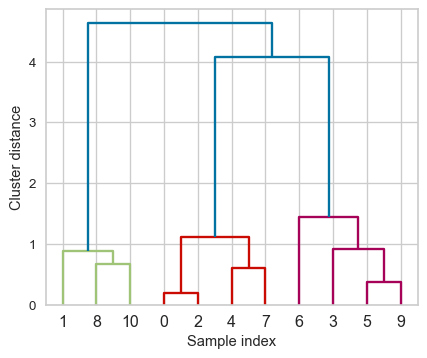
- Dendrogram is a tree-like plot.
- On the x-axis we have data points.
- On the y-axis we have distances between clusters.
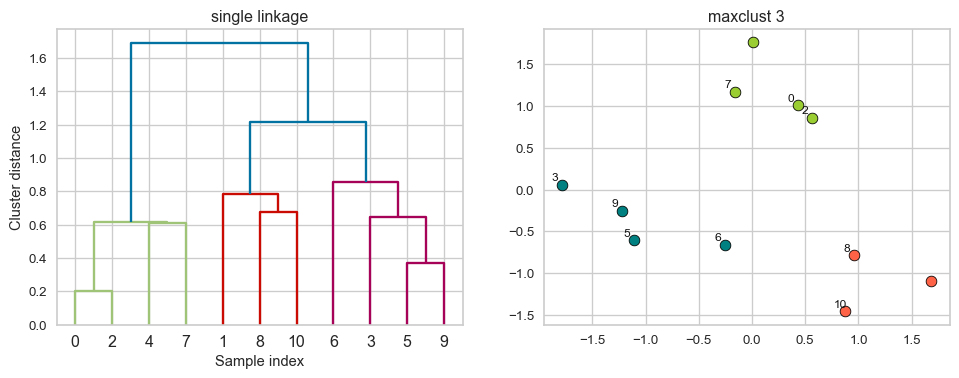
Flat clusters
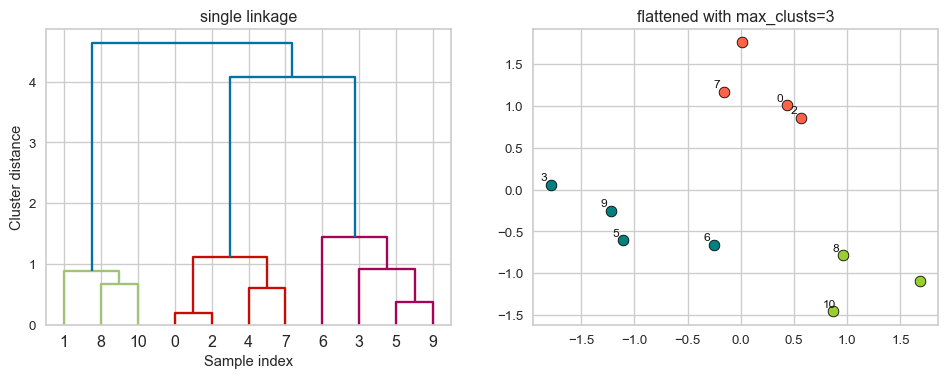
Example: Single linkage
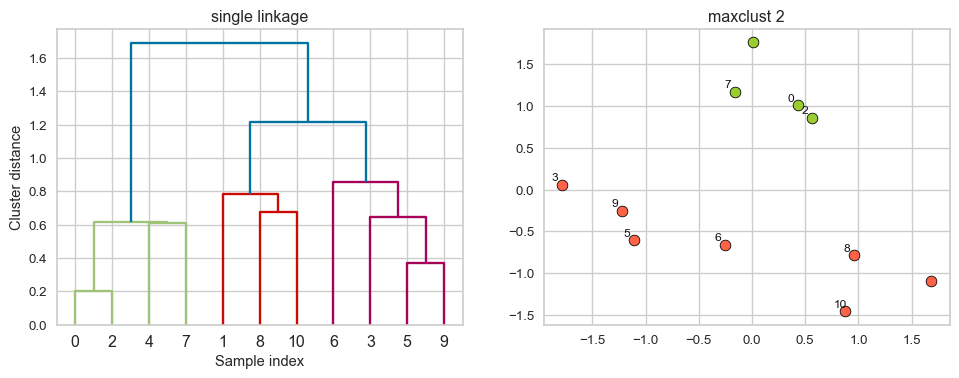
Suppose you want to go from 3 clusters to 2 clusters. Which clusters would you merge?
Example: Single linkage
Happy Halloween

![]()