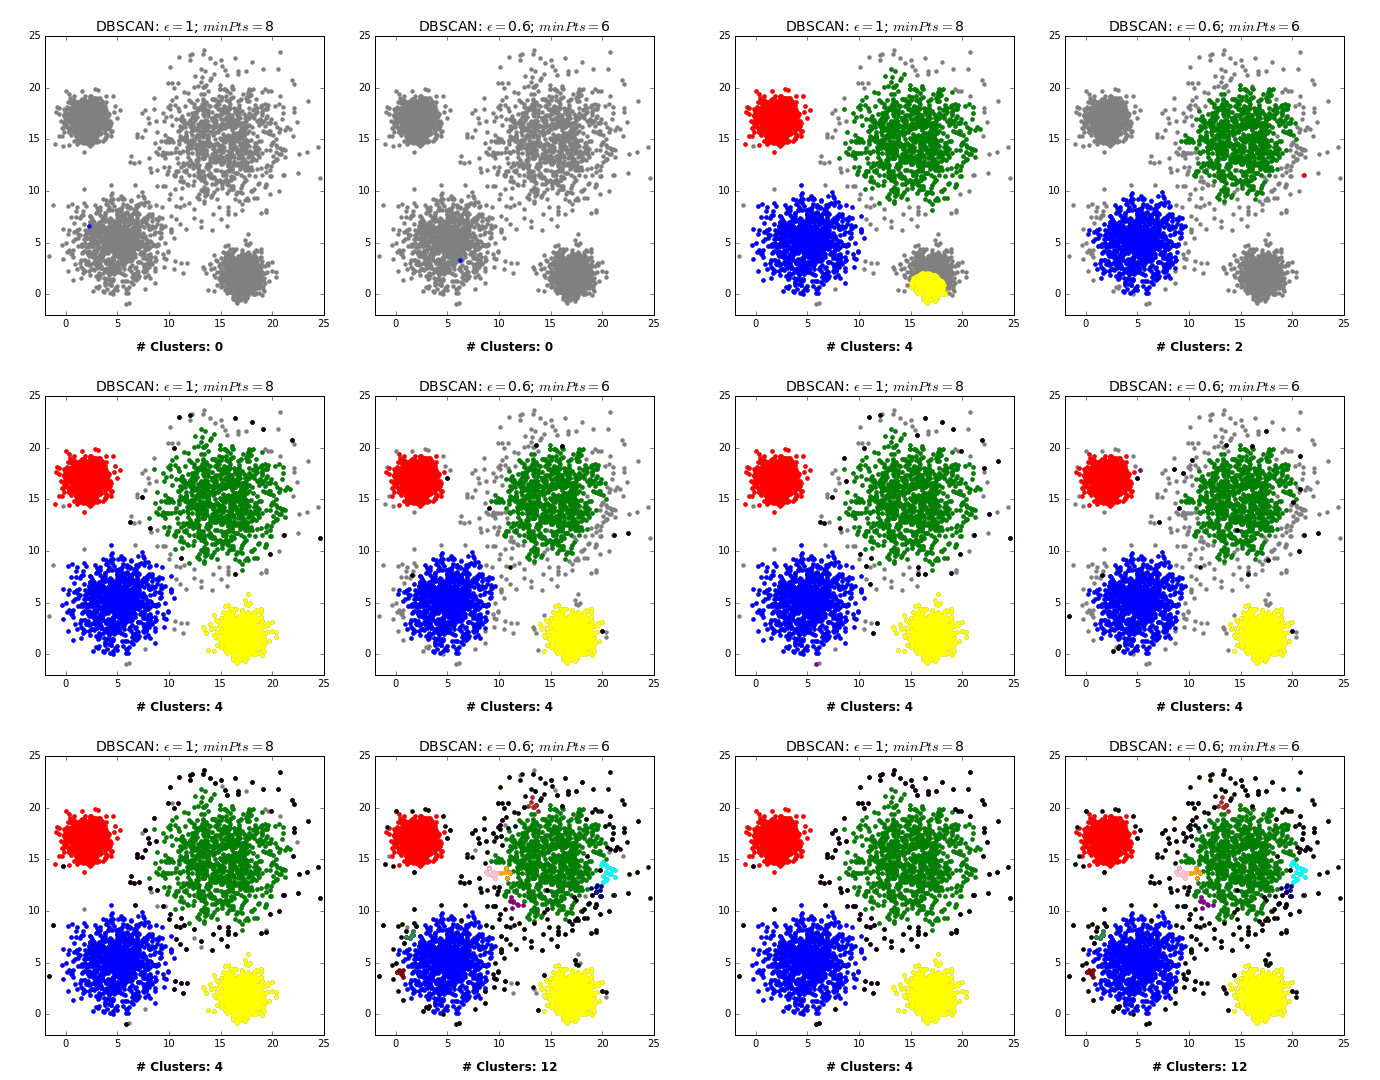
CPSC 330 Lecture 16: DBSCAN, Hierarchical Clustering
Announcements
- HW5 extension: Was due yesterday
- HW6 is due next week Wednesday.
- Computationally intensive
- You need to install many packages

iClicker Exercise 16.1
Select all of the following statements which are TRUE.
- Similar to K-nearest neighbours, K-Means is a non parametric model.
- The meaning of K in K-nearest neighbours and K-Means clustering is very similar.
- Scaling of input features is crucial in clustering.
- Scaling of input features is crucial in clustering.
- In clustering, it’s almost always a good idea to find equal-sized clusters.
K-means Limitations
Shape of clusters
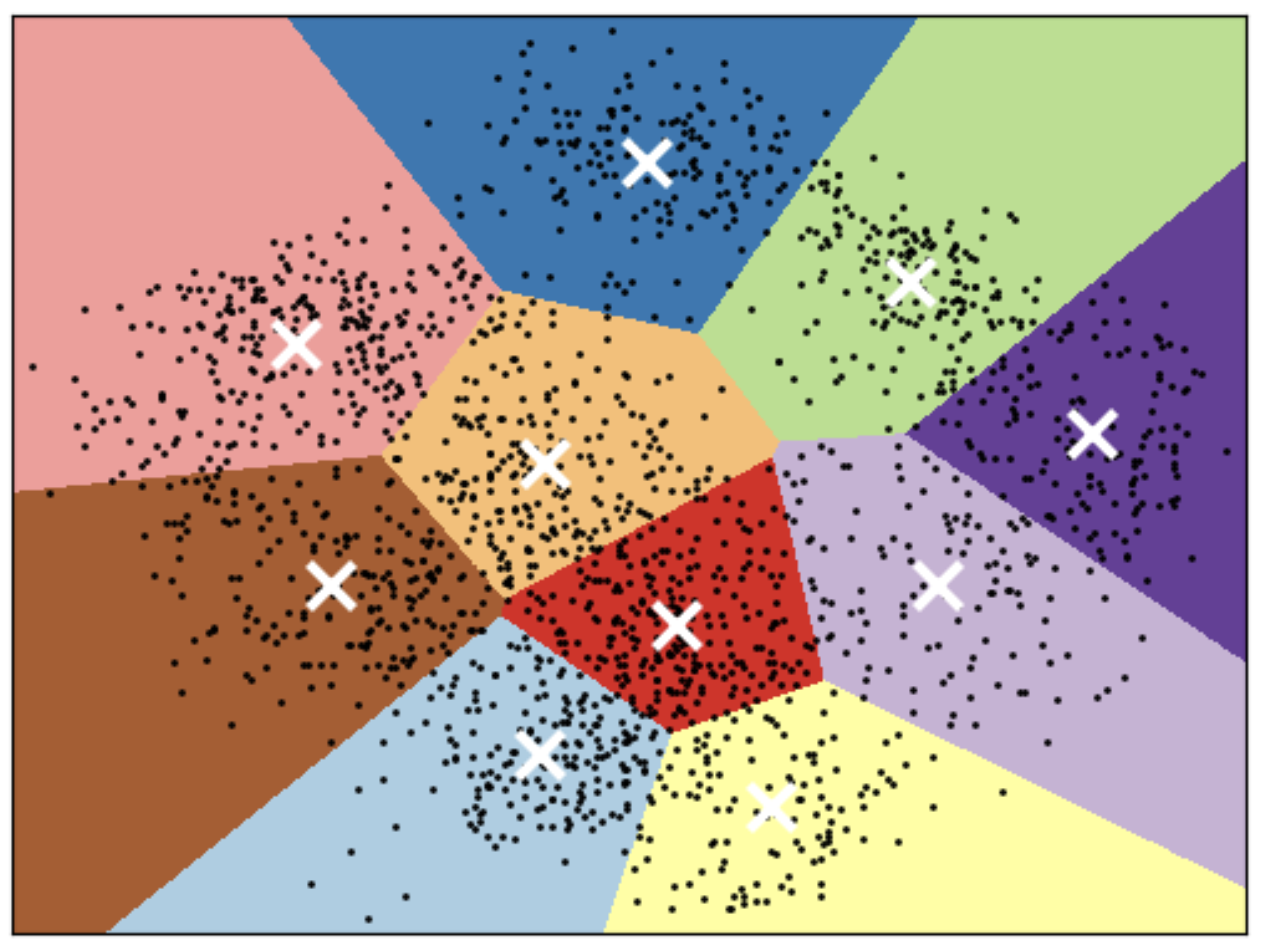
- Good for spherical clusters of more or less equal sizes
![]()
K-Means: failure case 1
- K-Means performs poorly if the clusters have more complex shapes (e.g., two moons data below).

K-Means: failure case 2
- Again, K-Means is unable to capture complex cluster shapes.

K-Means: failure case 3
- It assumes that all directions are equally important for each cluster and fails to identify non-spherical clusters.

Can we do better?
DBSCAN
- Density-Based Spatial Clustering of Applications with Noise
- A density-based clustering algorithm

How does it work?

DBSCAN Analogy
Consider DBSCAN in a social context:
- Social butterflies (🦋): Core points
- Friends of social butterflies who are not social butterflies: Border points
- Lone wolves (🐺): Noise points
Two main hyperparameters
eps: determines what it means for points to be “close”min_samples: determines the number of neighboring points we require to consider in order for a point to be part of a cluster
DBSCAN: failure cases
- Let’s consider this dataset with three clusters of varying densities.
- K-Means performs better compared to DBSCAN. But it has the benefit of knowing the value of K in advance.
[ 0 1 2 3 4 5 6 7 8 9 10 11 12 13 14 15]
Hierarchical clustering

Dendrogram
Flat clusters
- This is good but how can we get cluster labels from a dendrogram?
- We can bring the clustering to a “flat” format use
fcluster

Linkage criteria
- When we create a dendrogram, we need to calculate distance between clusters. How do we measure distances between clusters?
- The linkage criteria determines how to find similarity between clusters:
- Some example linkage criteria are:
- Single linkage → smallest minimal distance, leads to loose clusters
- Complete linkage → smallest maximum distance, leads to tight clusters
- Average linkage → smallest average distance between all pairs of points in the clusters
- Ward linkage → smallest increase in within-cluster variance, leads to equally sized clusters
Activity
- Fill in the table below in this Google doc
| Clustering Method | KMeans | DBSCAN | Hierarchical Clustering |
|---|---|---|---|
| Approach | |||
| Hyperparameters | |||
| Shape of clusters | |||
| Handling noise | |||
| Examples |
Class demo

